Hydrogen Iodide
Three theoretical calculations were completed for the hydrogen
iodide molecule; the basis sets used were 3-21G, SPK-DZP, and SPKr-TZP.
Bond Length
Theoretical bond lengths were calculated via three levels of theory.
Table 1: The calculated and experimental bond length of H-I.
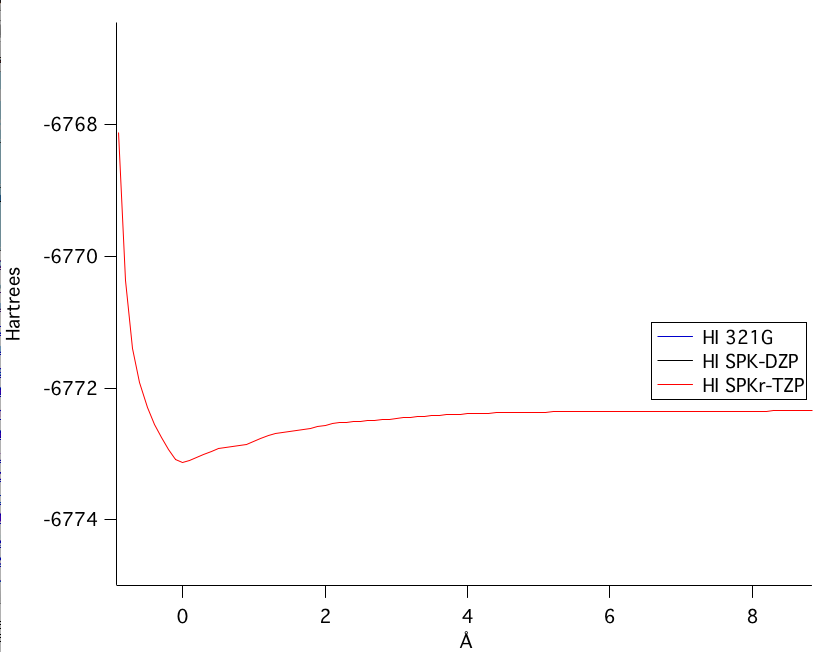
The SPKr-TZP model was the highest level of theory calculated. Figure 1 shows the bond length of the SPKr-TZP.
The SPK-DZP basis set, although not the highest level of theory used, calculated the closest bond length value to a comparable experimental value from the National Institute of Standards and Technology. Moreover, in the potential energy of bond stretching, the SPK-DZP had a lower overall potential energy calculated than any of the other basis sets used. Therefore, the SPK-DZP basis set provided the most accurate theoretical bond length. | ||||||||||||||||||||||||||||||||||||||||
HOMO
The highest occupied molecular orbital (HOMO) is the furthest shell from the nucleus that contains electrons in an atom or molecule. Figure 2 shows the calculated HOMO of the hydrogen iodide molecule. This was calculated using the SPK-DZP basis set, because of the same reason stated in the bond length section. | ||||||||||||||||||||||||||||||||||||||||
LUMOThe lowest unoccupied molecular orbital (LUMO) is the closest vacant electron shell to the nucleus.
Figure 3 shows the calculated LUMO of the hydrogen iodide molecule. This was calculated using the SPK-DZP basis set. | ||||||||||||||||||||||||||||||||||||||||
Electrostatic Potential
The electrostatic potential map in figure 4 shows the regions of electron density. The red region surrounding the iodine atom in the molecule has a higher electron density than blue region around the hydrogen atom. The electrostatic potential qualitatively illustrates the next to sections where the calculated partial atomic charges and dipole moment vectors of the hydrogen iodide molecule are shown. In addition, the electrostatic potential map displays the relative charge distribution and shape of the molecule. Those two specific points, relative charge distribution and shape of the molecule, are corroborated in the relative shape of the HOMO figure and the polarity of the molecule in the calculated dipole moment. | ||||||||||||||||||||||||||||||||||||||||
Partial Atomic Charge
The partial atomic charge for hydrogen iodide show the distribution of
electron among the connected atoms. From the calculated partial atomic
charge, the charge on the hydrogen is 0.07988, while the charge on the
iodide atom is -0.07988. The overall charge is therefore neutral
in this diatomic molecule.
Figure 5 shows the partial atomic charges of hydrogen iodide. | ||||||||||||||||||||||||||||||||||||||||
Dipole Moment
Table 2: The calculated and experimental dipole moment of hydrogen iodide.
Additionally an improve dipole moments was calculated by adding diffuse functions and doing a combination of them, from the combination the best improve dipole moment was chosen and are shown in table 3. Table 3: The calculated improved dipole moments of hydrogen iodide.
Vibrational Frequency
The experimental vibrational frequency is approximate to the calculated values of the 3-21G and the SPK-DZP, however there is a larger error when comparing it to the SPKr-TZP basis set. Potential Energy of Bond Stretching
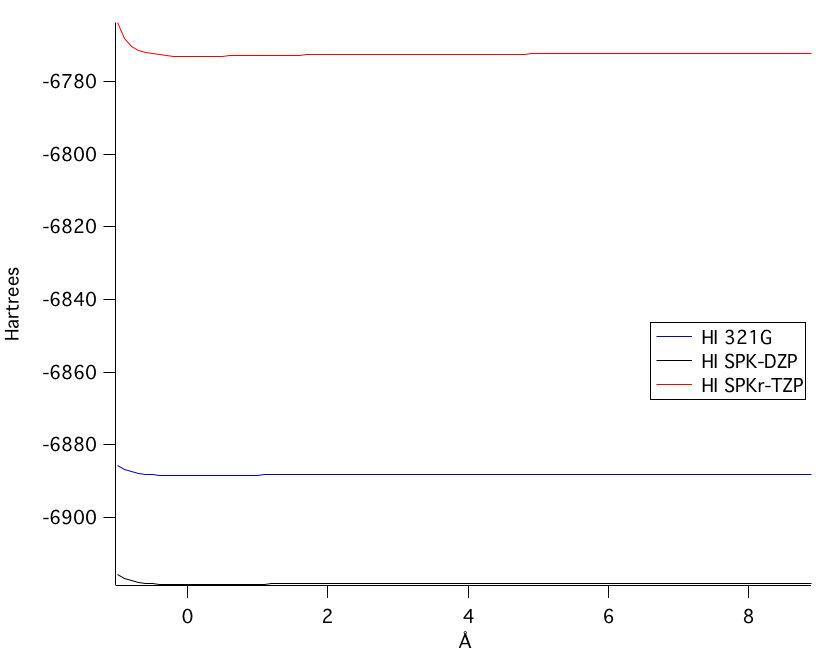
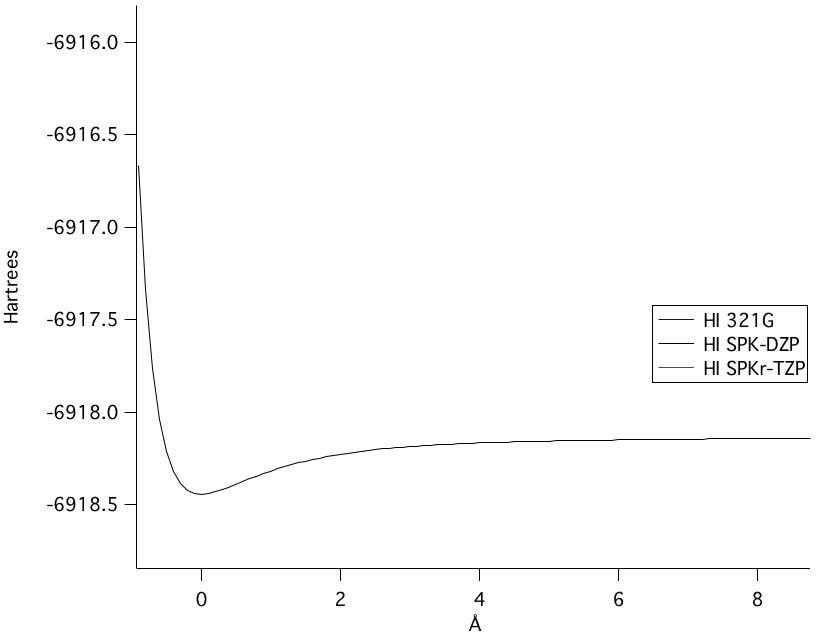
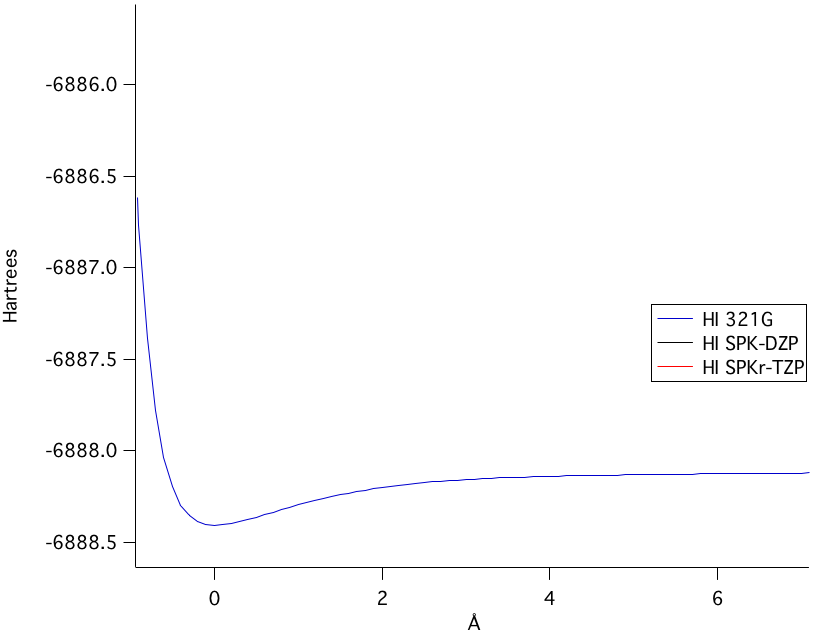
The potential energy of bond stretching is shown in the four graphs above. Starting at the top left graph and moving clockwise: all three basis set's potential energy functions overlain, the SPK-DZP basis set, the SPKr-TZP set, and the 3-21G set. The lowest energy level of theory calculated was the SPK-DZP basis set. Although the SPKr-TZP was the larger basis set, it had a higher potential energy than the other two sets. This was also consistent with the SKP-DZP basis set calculations were, in general, closer to the experimental values. Pictorial Orbital DiagramFigure 7: The representation of the MO diagram of hydrogen iodide 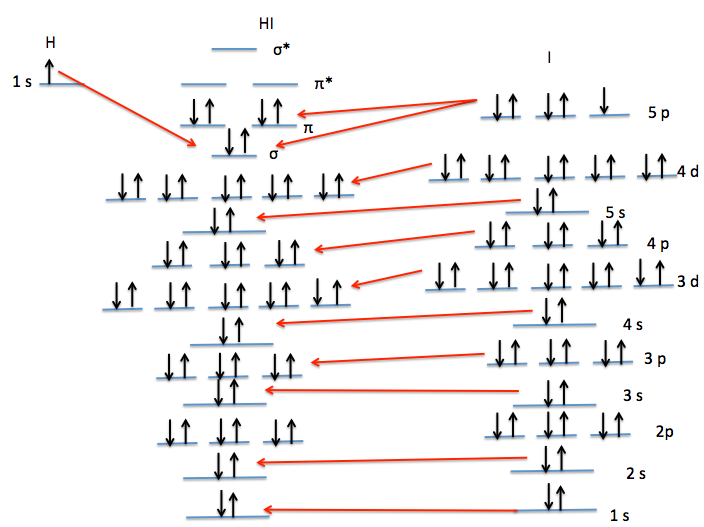 Refrences1. http://cccbdb.nist.gov/ . Geometries. Experimental geometry data for a given species. HI.2. http://cccbdb.nist.gov/ . Dipoles. Experimental data. HI. 3.http://cccbdb.nist.gov/ . Dipoles. Calculated data. HI 4. http://cccbdb.nist.gov/ . Vibrations. Experimental vibrational data for a given species. HI |
Page skeleton and JavaScript generated by export to web function using Jmol 14.1.8 2014-02-10 21:43: on Mar 8, 2014.