Fluorine Gas (F2)
Geometery Optimization
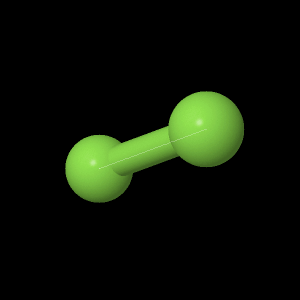
Optimized Geometries of the F2 model were obtained using four different levels of theory, specifically AM1, 6-21G, 6-31G, and Double Zeta Valence (DZV). The F2 model displayed on the right were made using DZV, the highest ab initio level of theory.
The button below displays the optimized geometry and F-F Bond Length obtained from using the DZV level of theory.
|
|
Table 1 compares the F - F bond lengths obtained for the four levels of theory and the literature value.
Table 1. Comparison of Bond Lengths Obtained for AM1, 6-21G, 6-31G and DZV Levels of Theory to the Theoretical F - F Bond Length.
| Level
of Theory |
Bond
Length (Å) |
| AM1 6-21G 6-31G DZV Literature |
1.30 1.43 1.43 1.43 1.44 |
As shown above, F-F bond length obtained using AM1 level of theory varies greatly compared to 6-21G, 6-31G, and DZV levels of theory primarily because AM1 has a smaller basis set compared to the other levels of theory. However, the 6-21G, 6-31G, and DZV levels of theory does not vary due to the simplicity of the molecule being studied. In other words, a 6-21G basis set is enough to optimize the geometry of a homonuclear diatomic molecule. Having a larger basis set does not affect geometry optimization for this type of molecule. Calculated bond length for 6-21G, 6-31G, and DZV are relatively close compared to the theoretical value.
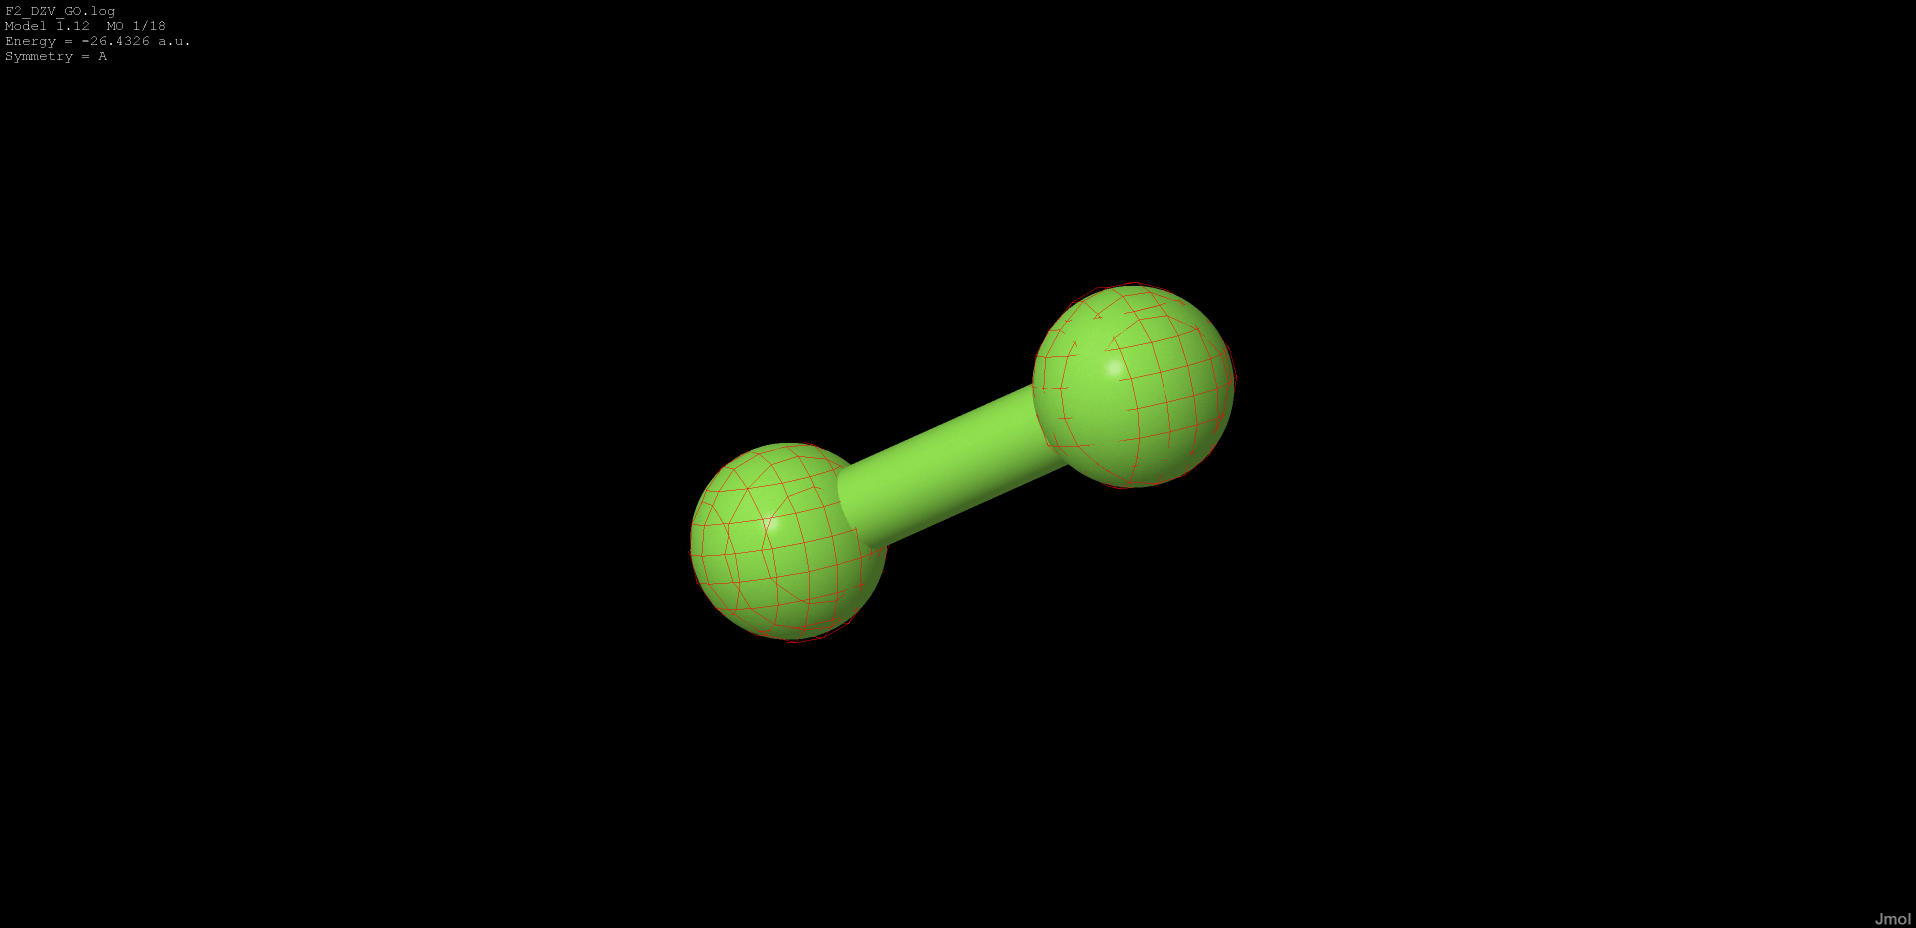
The following button displays the highest occupied molecular orbital (HOMO) of F2.
|
|
The lowest unoccupied molecular orbital (LUMO) is the next display shown. The molecular orbital was determined by taking the next molecular orbital that followed the HOMO.
|
|
Valence energy level diagrams can be used to qualitatively describe the molecular orbitals of a molecule. By analyzing the molecular orbital of each of the constituents of the molecule separately, the interaction between atomic orbitals of each atom can be predicted as the atoms move closer to form a bond. Figure 1 shows the molecular orbital diagram of F2.
Figure 1.
Molecular Orbital Diagram of F2.
Table 2. Energy Level Diagram
Table 2. Energy Level Diagram
| Orbital Diagram |
Energy (a.u.) |
Bond Type |
 |
-23.426 |
non-bonding |
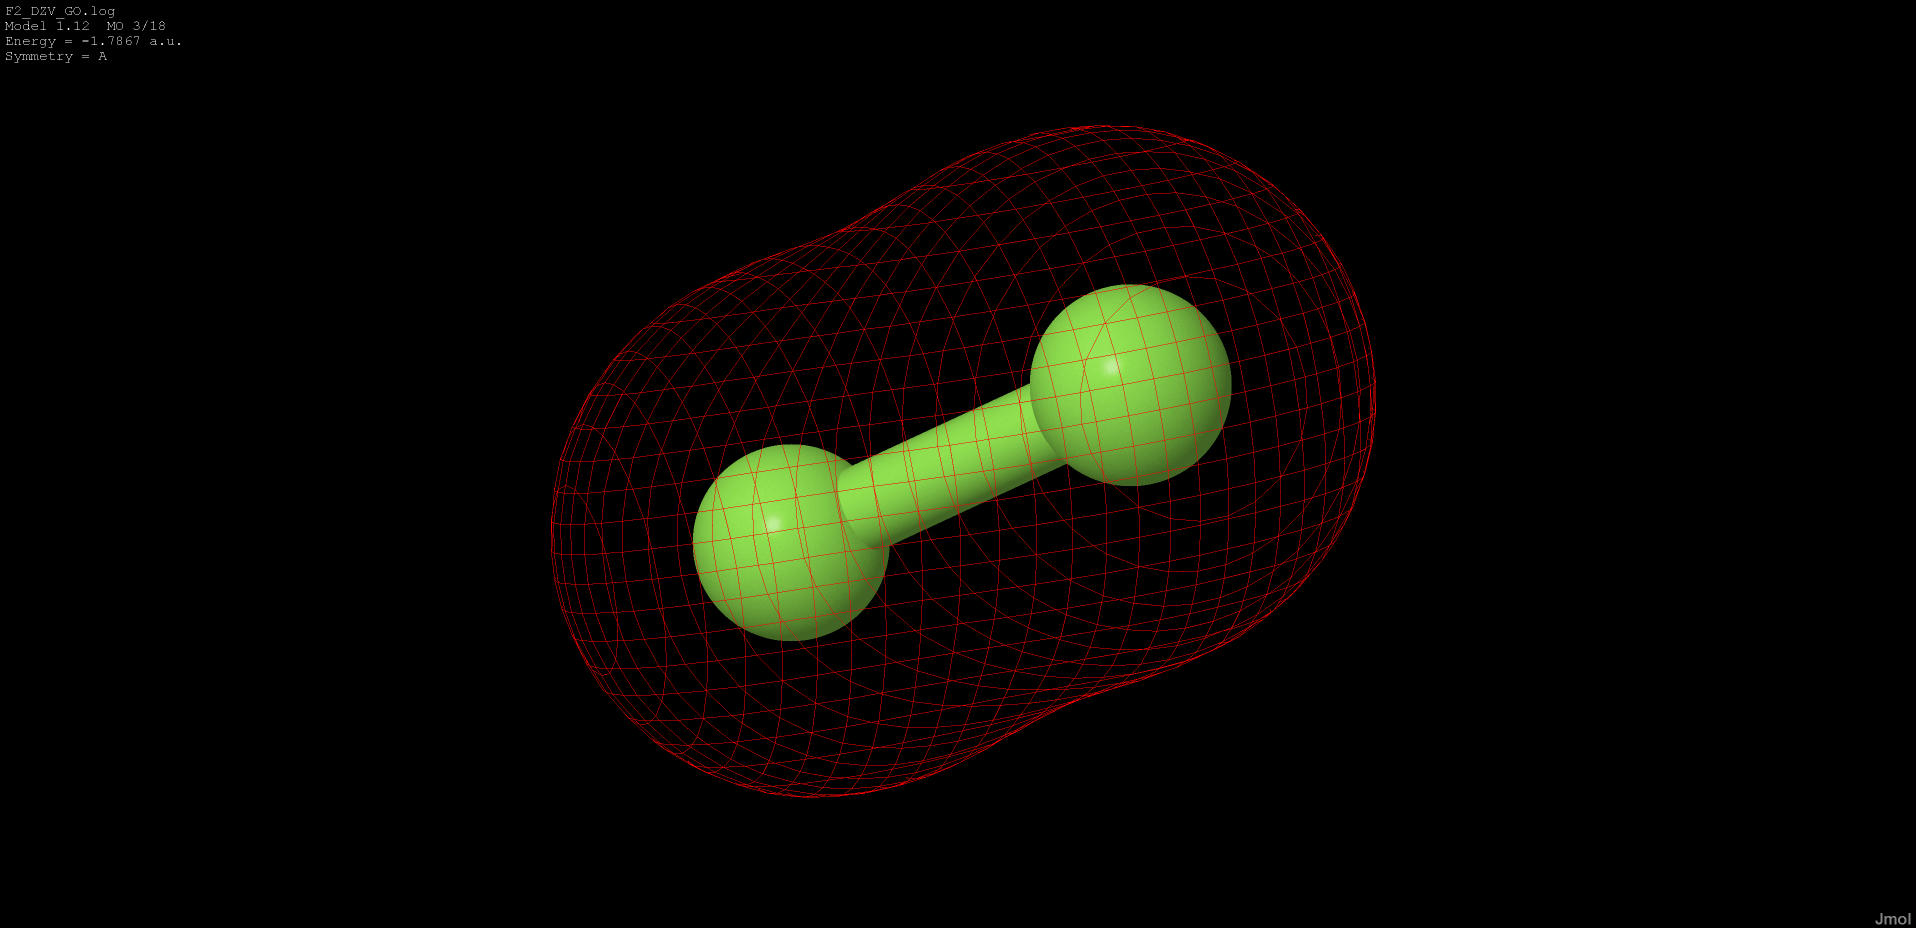 |
-1.786 |
bonding |
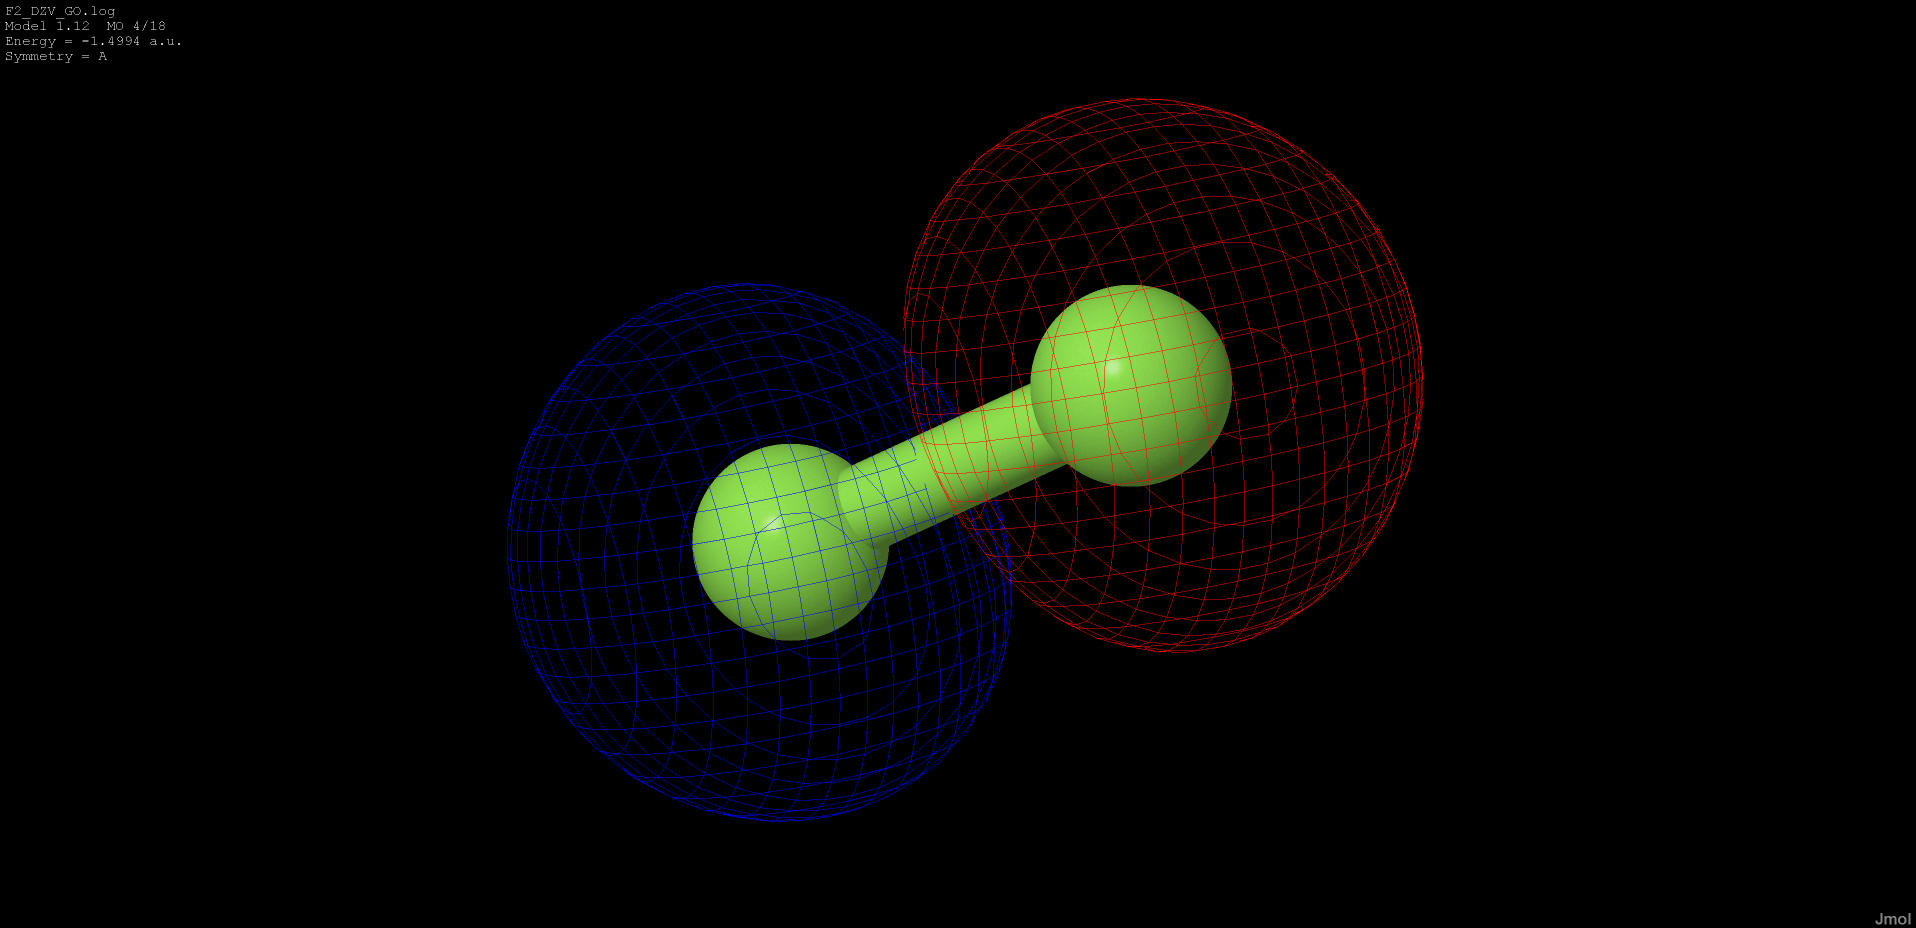 |
-1.499 |
anti-bonding |
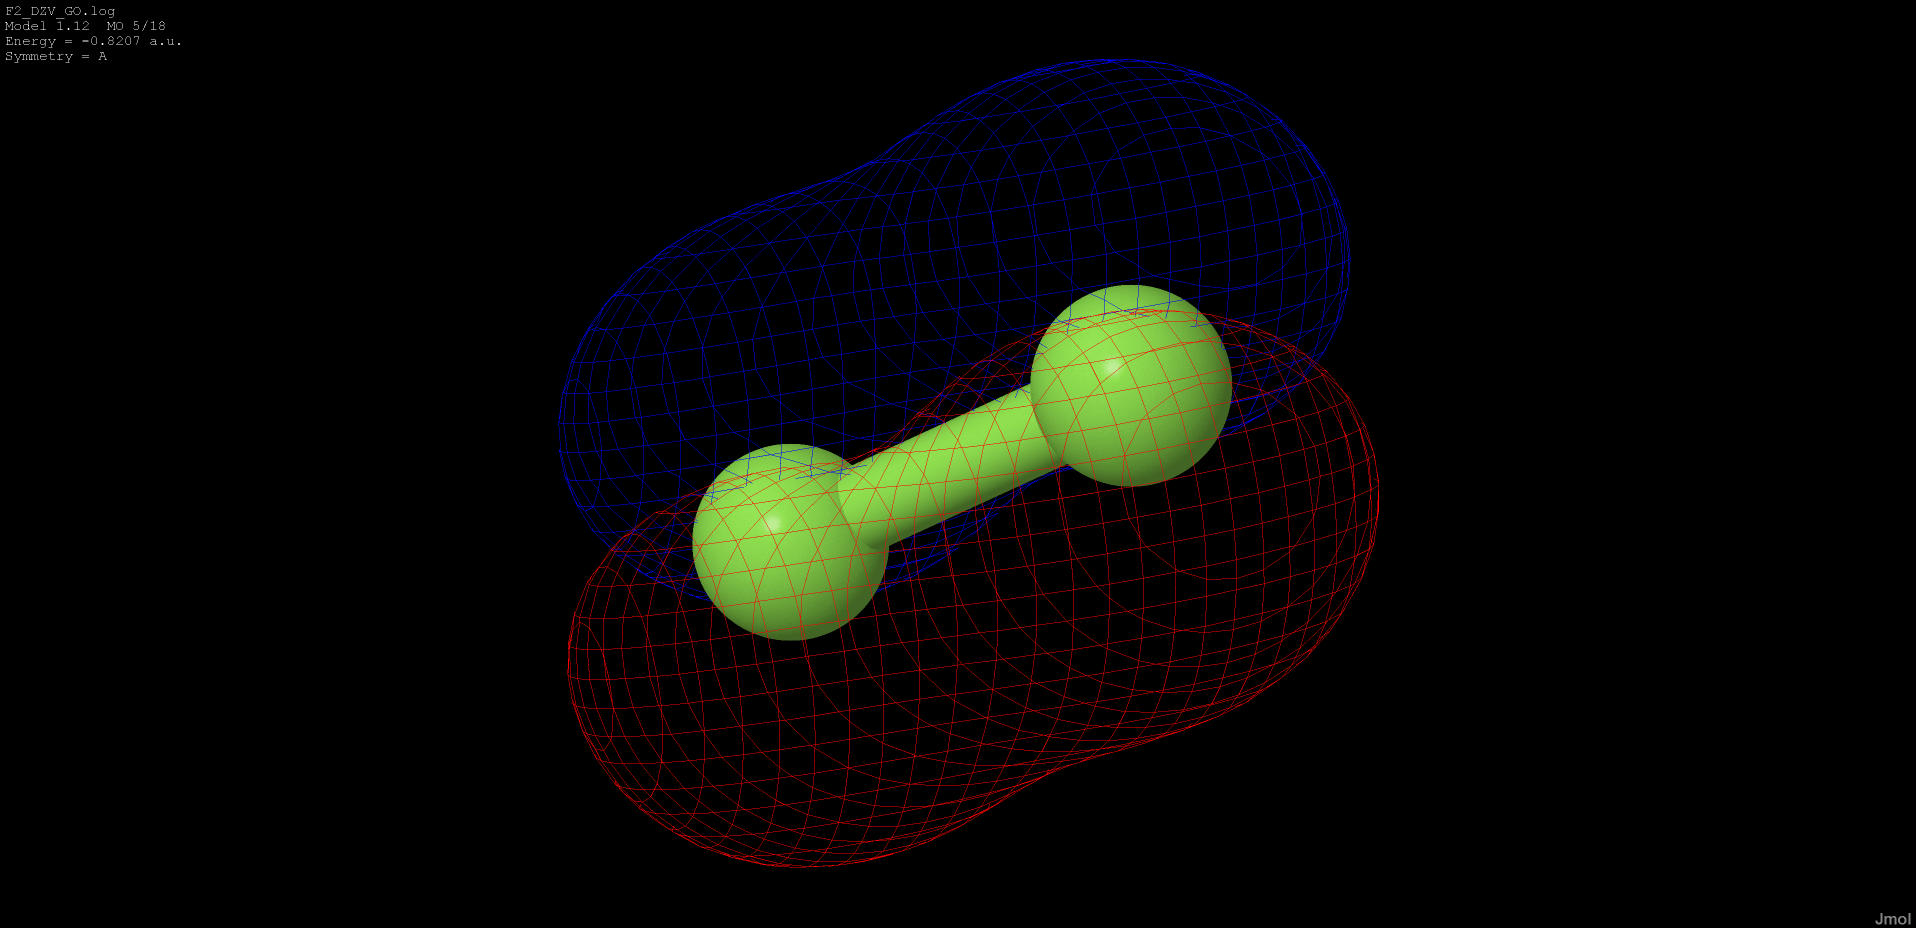 |
-0.821 |
anti-bonding |
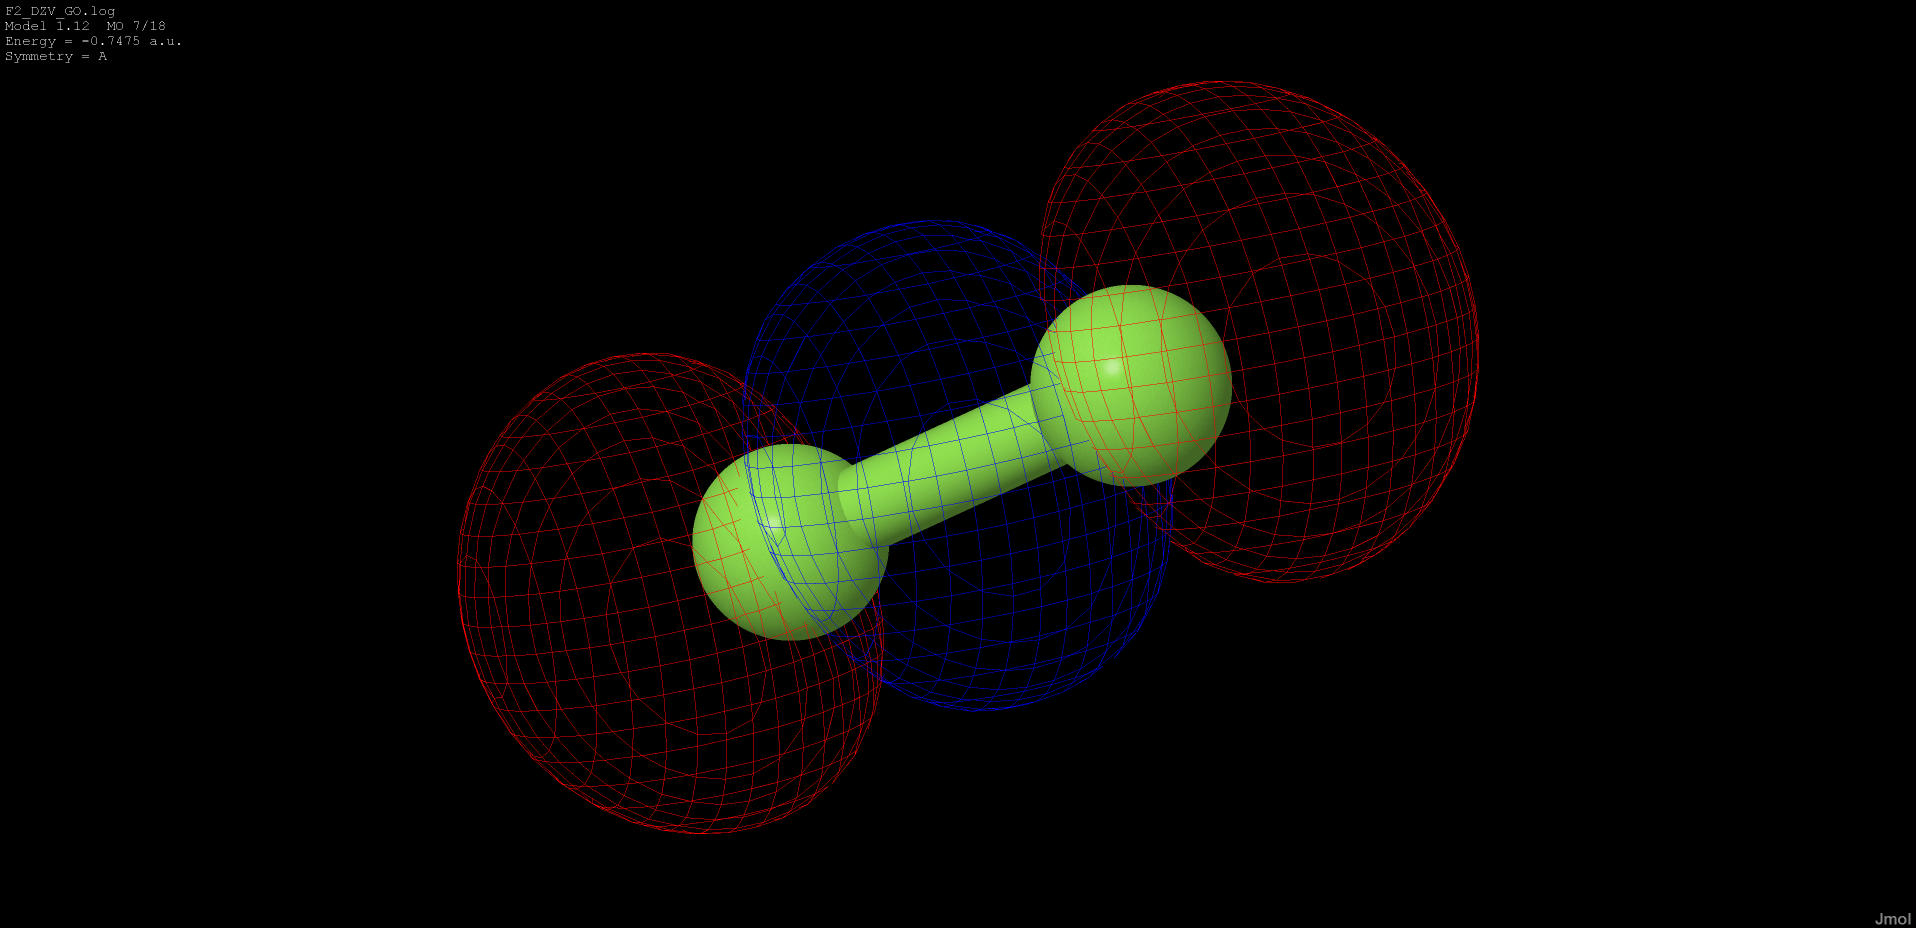 |
-0.747 |
anti-bonding |
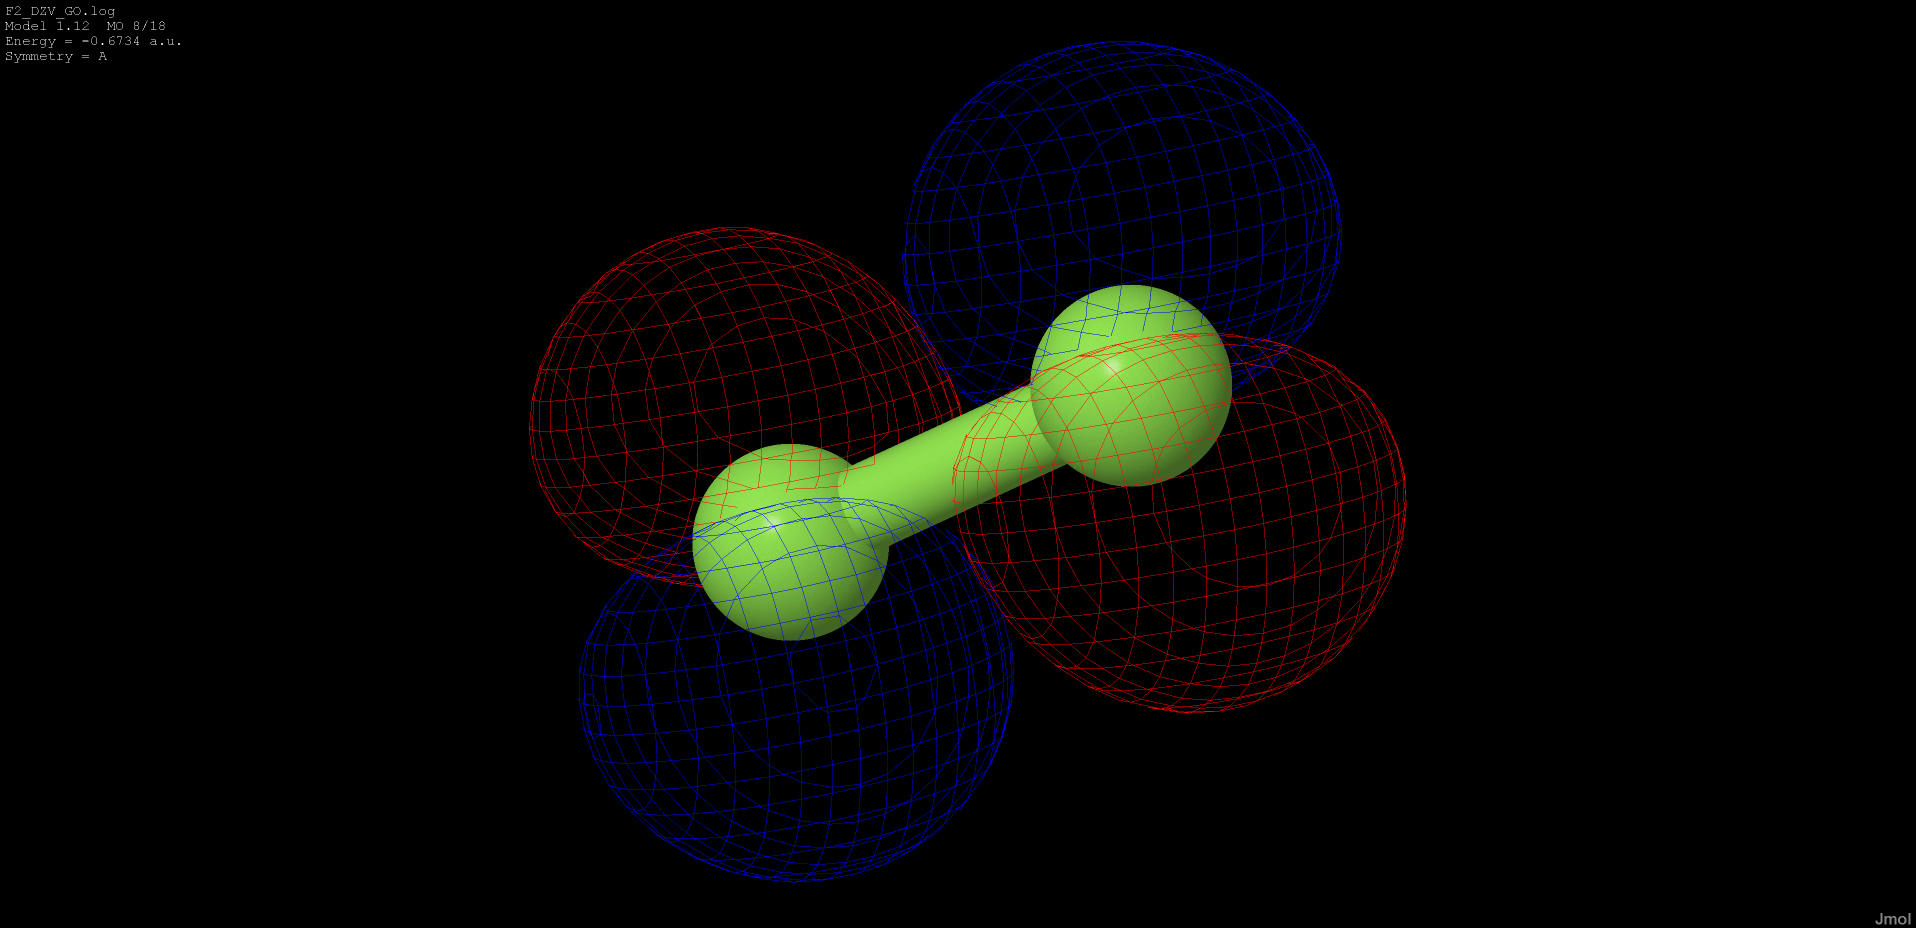 |
-0.673 |
anti-bonding |
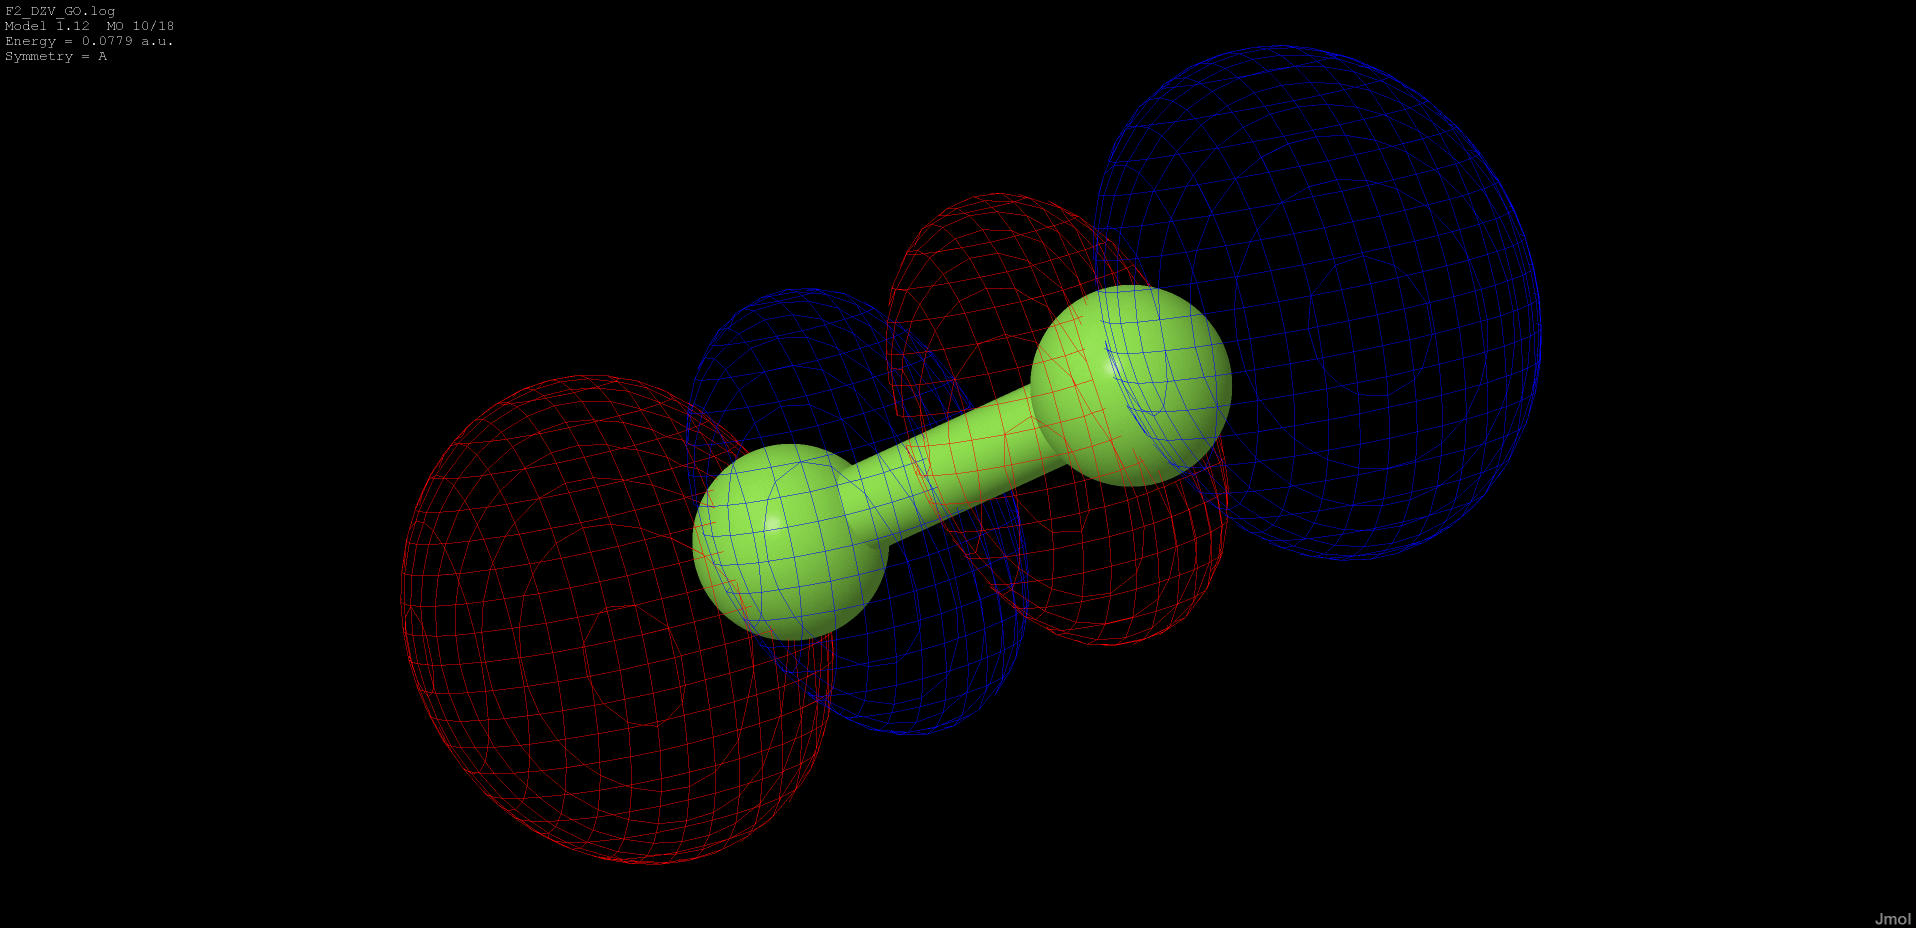 |
0.078 |
anti-bonding |
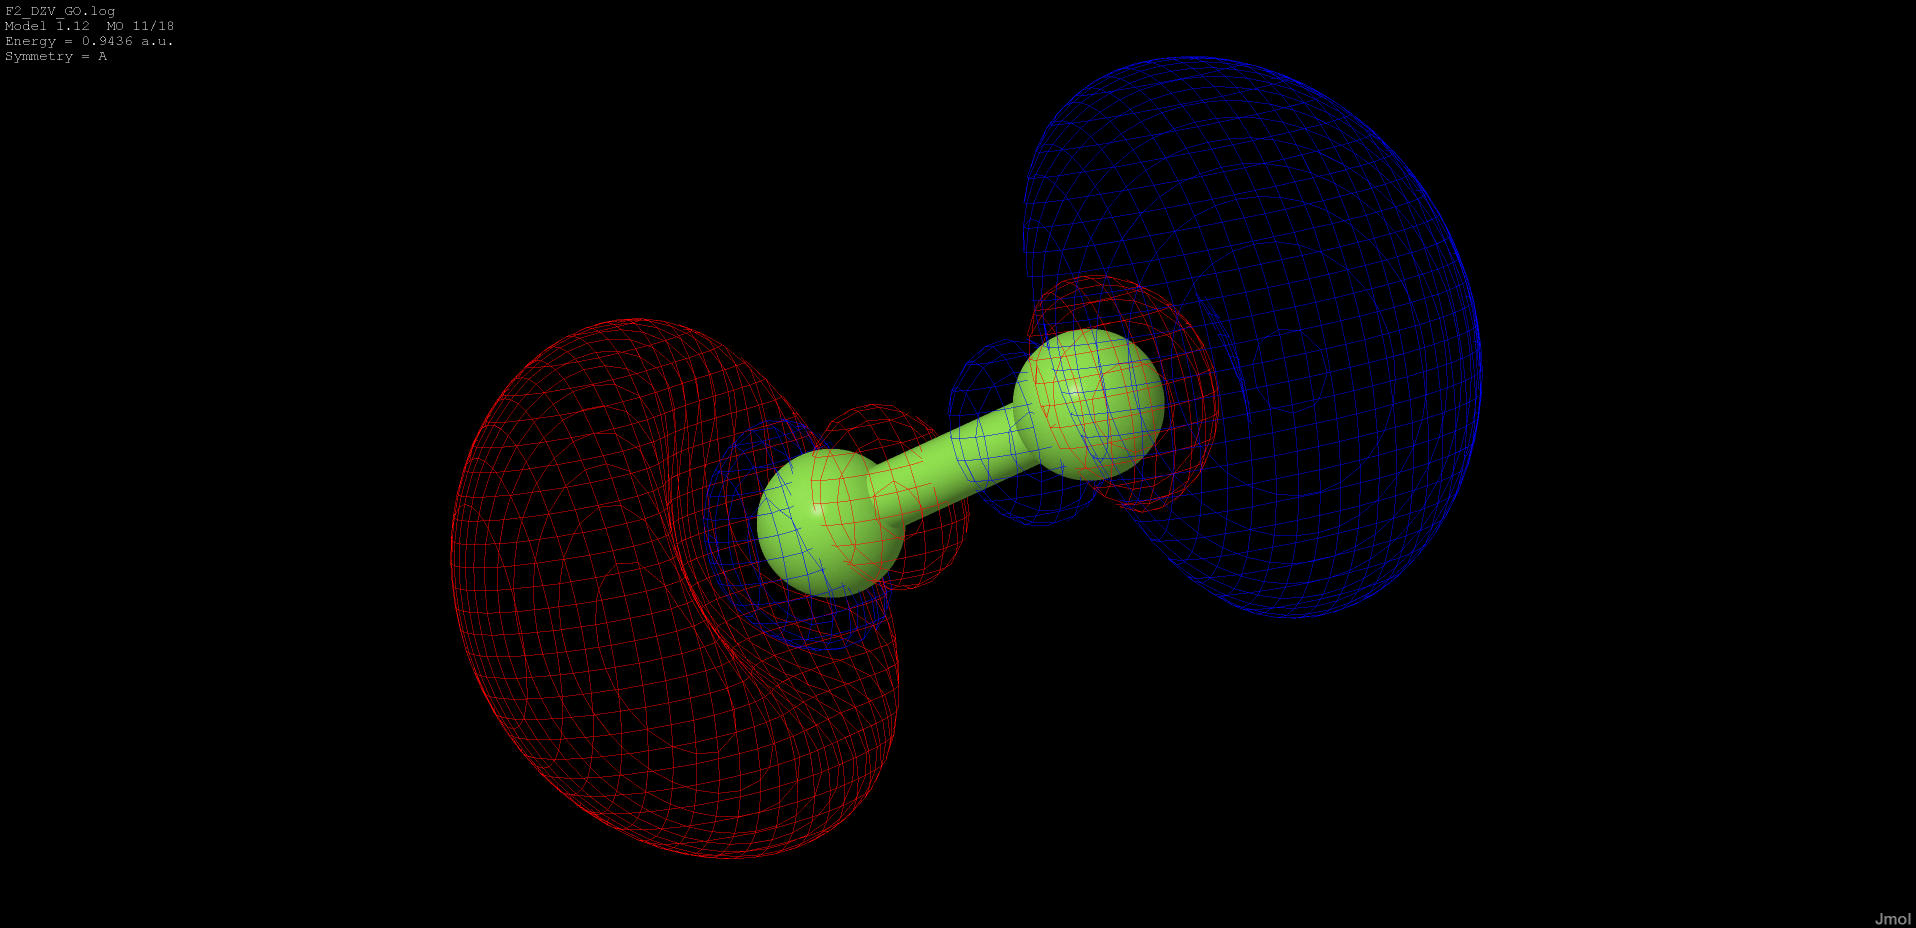 |
0.943 |
anti-bonding |
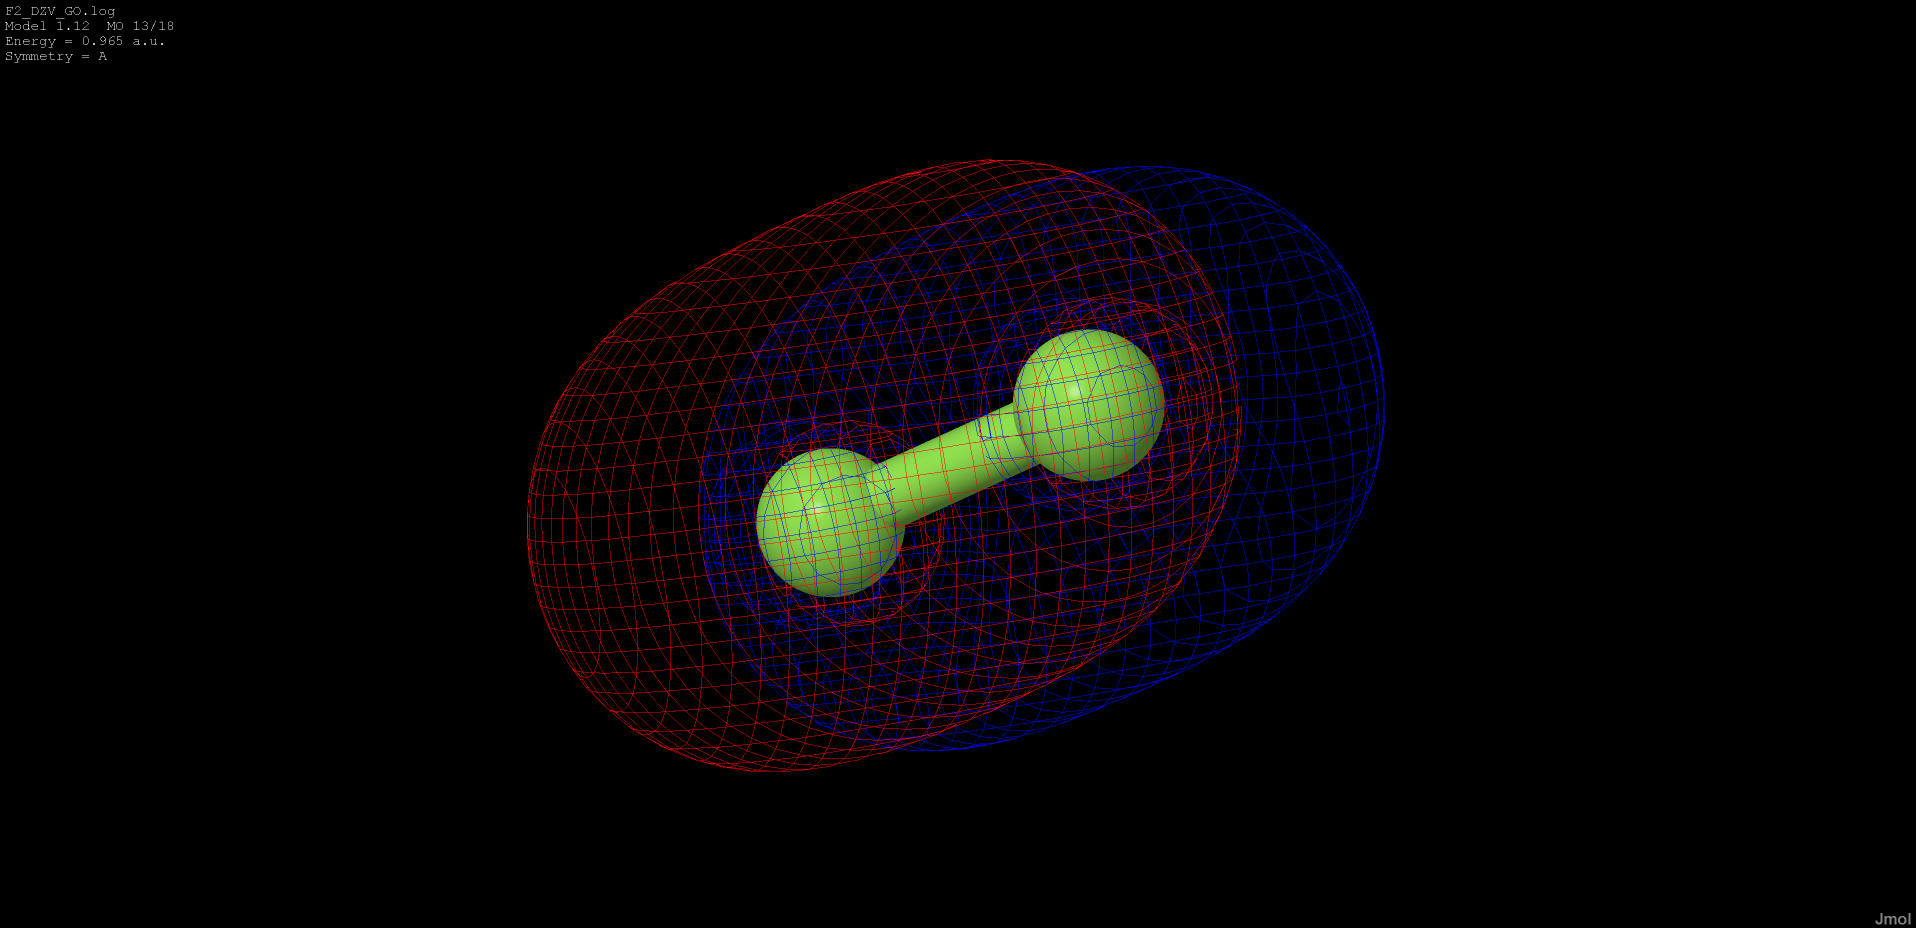 |
0.965 |
anti-bonding |
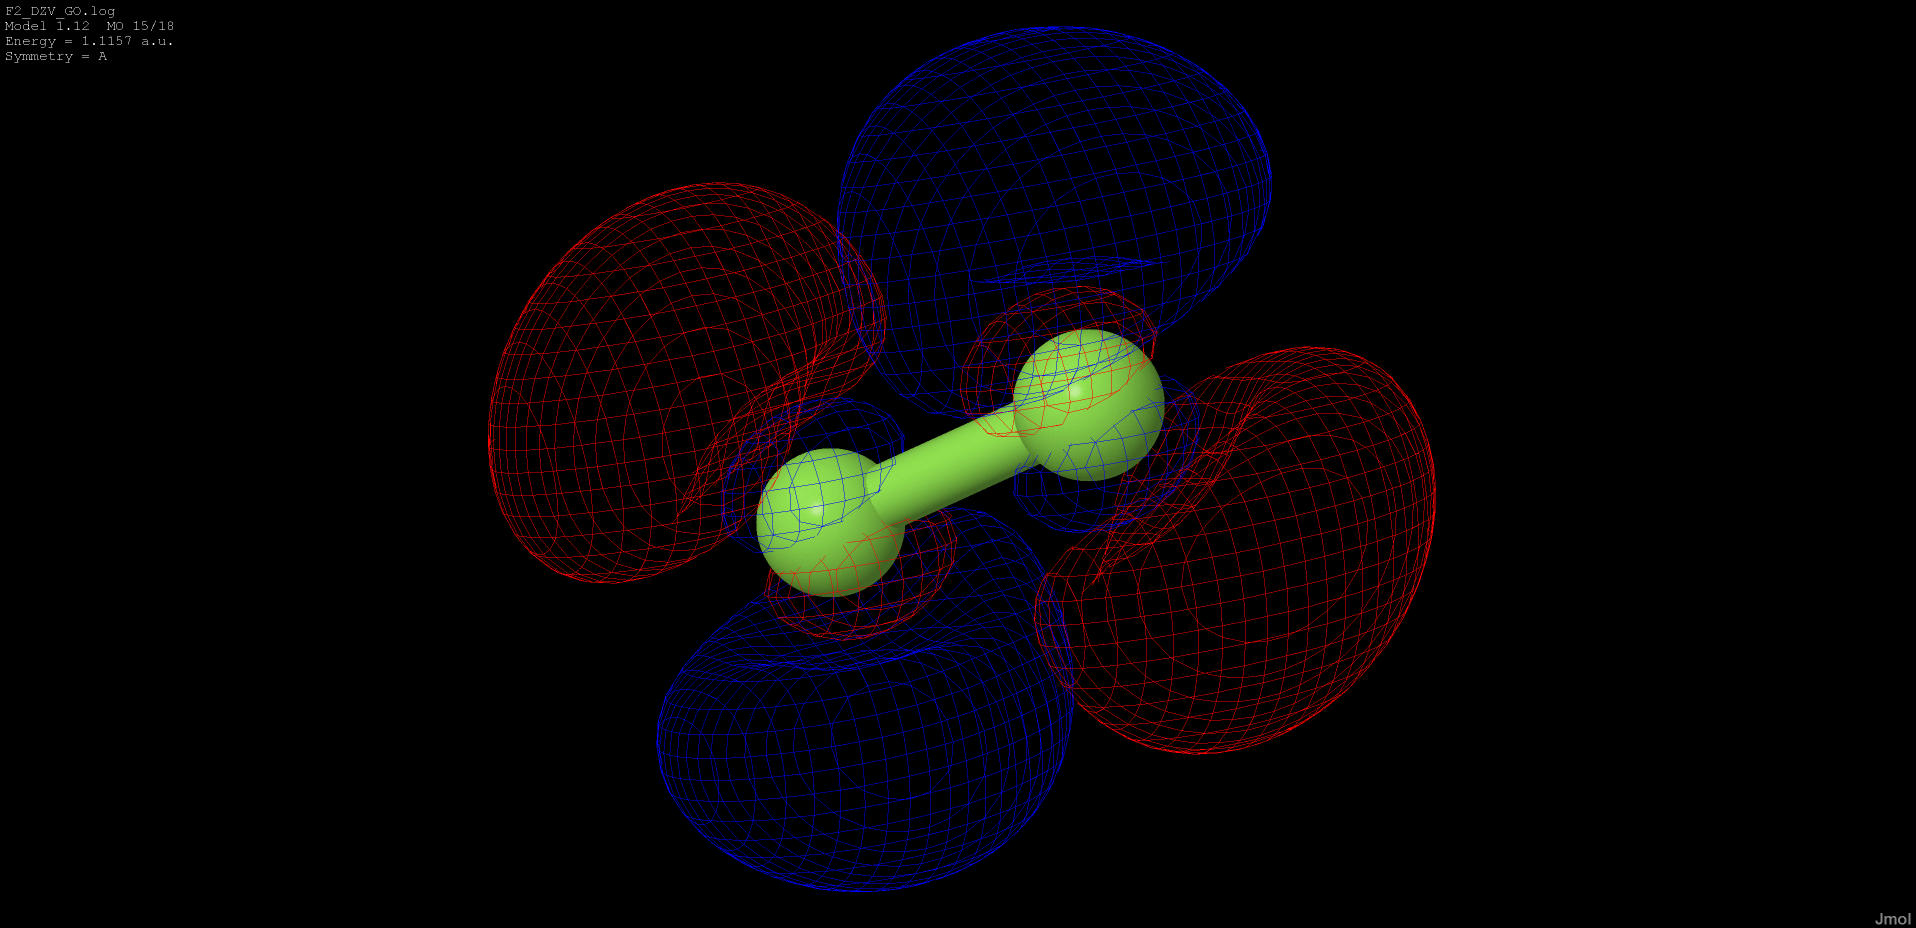 |
1.116 |
anti-bonding |
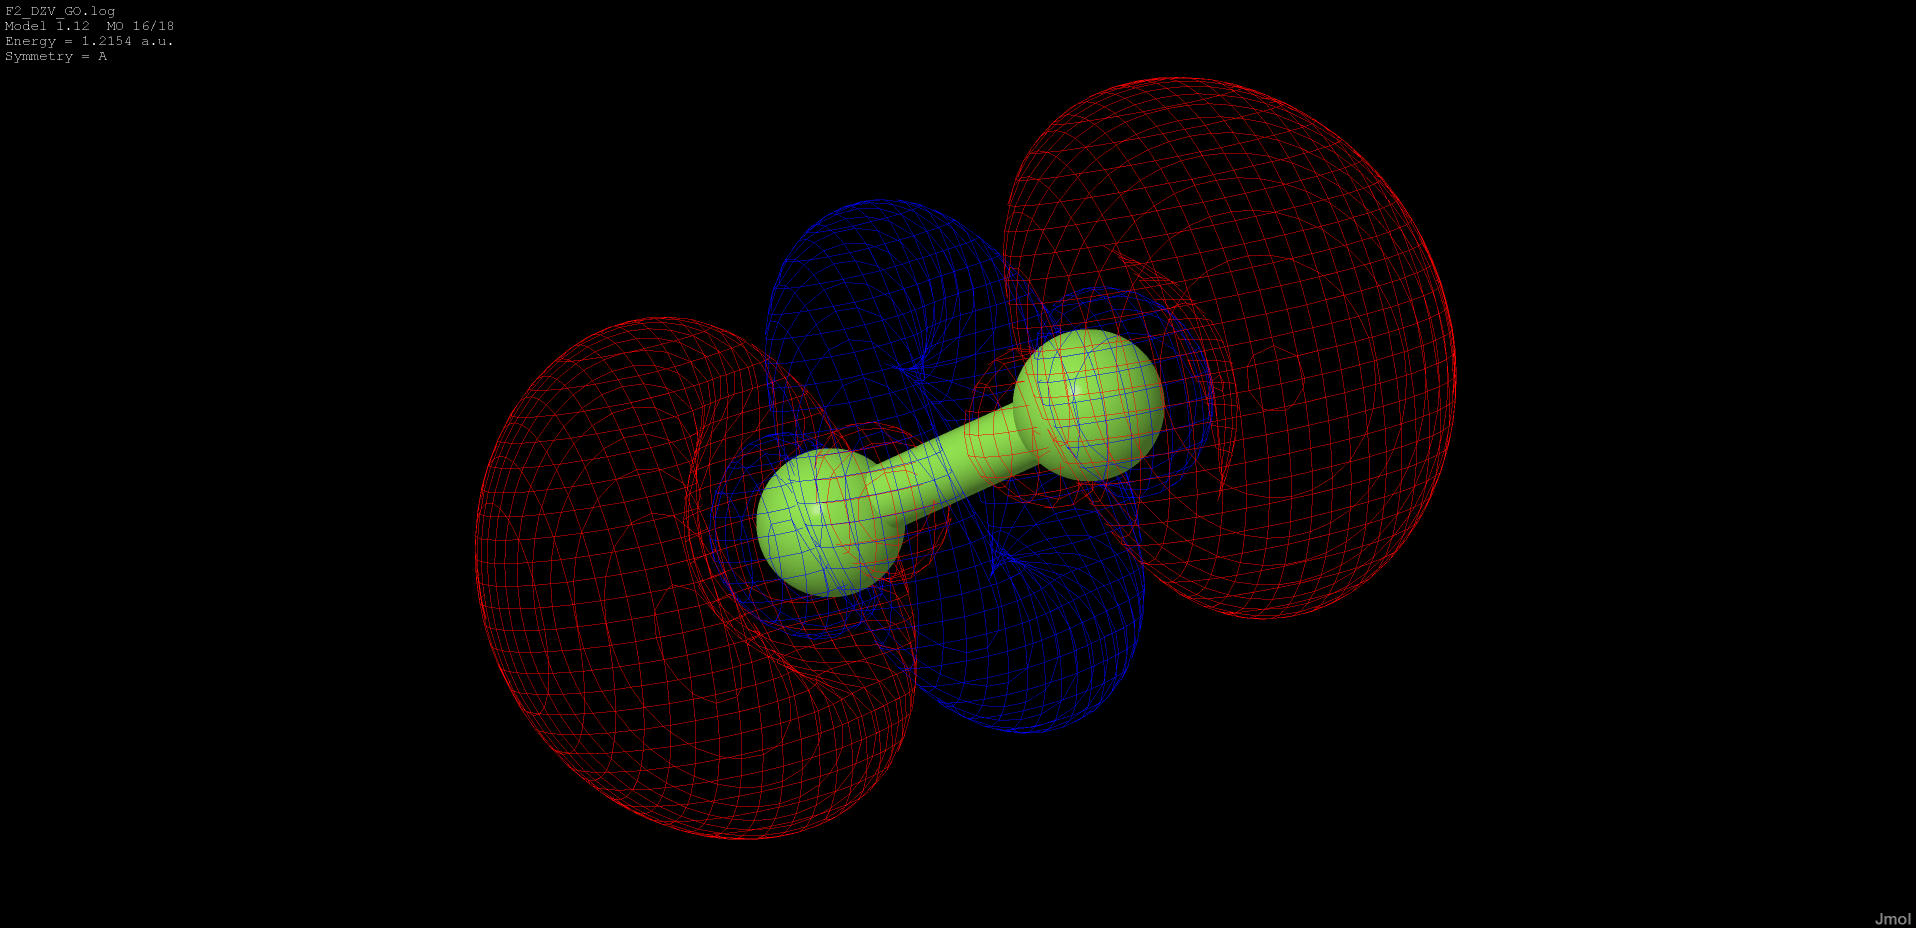 |
1.215 |
anti-bonding |
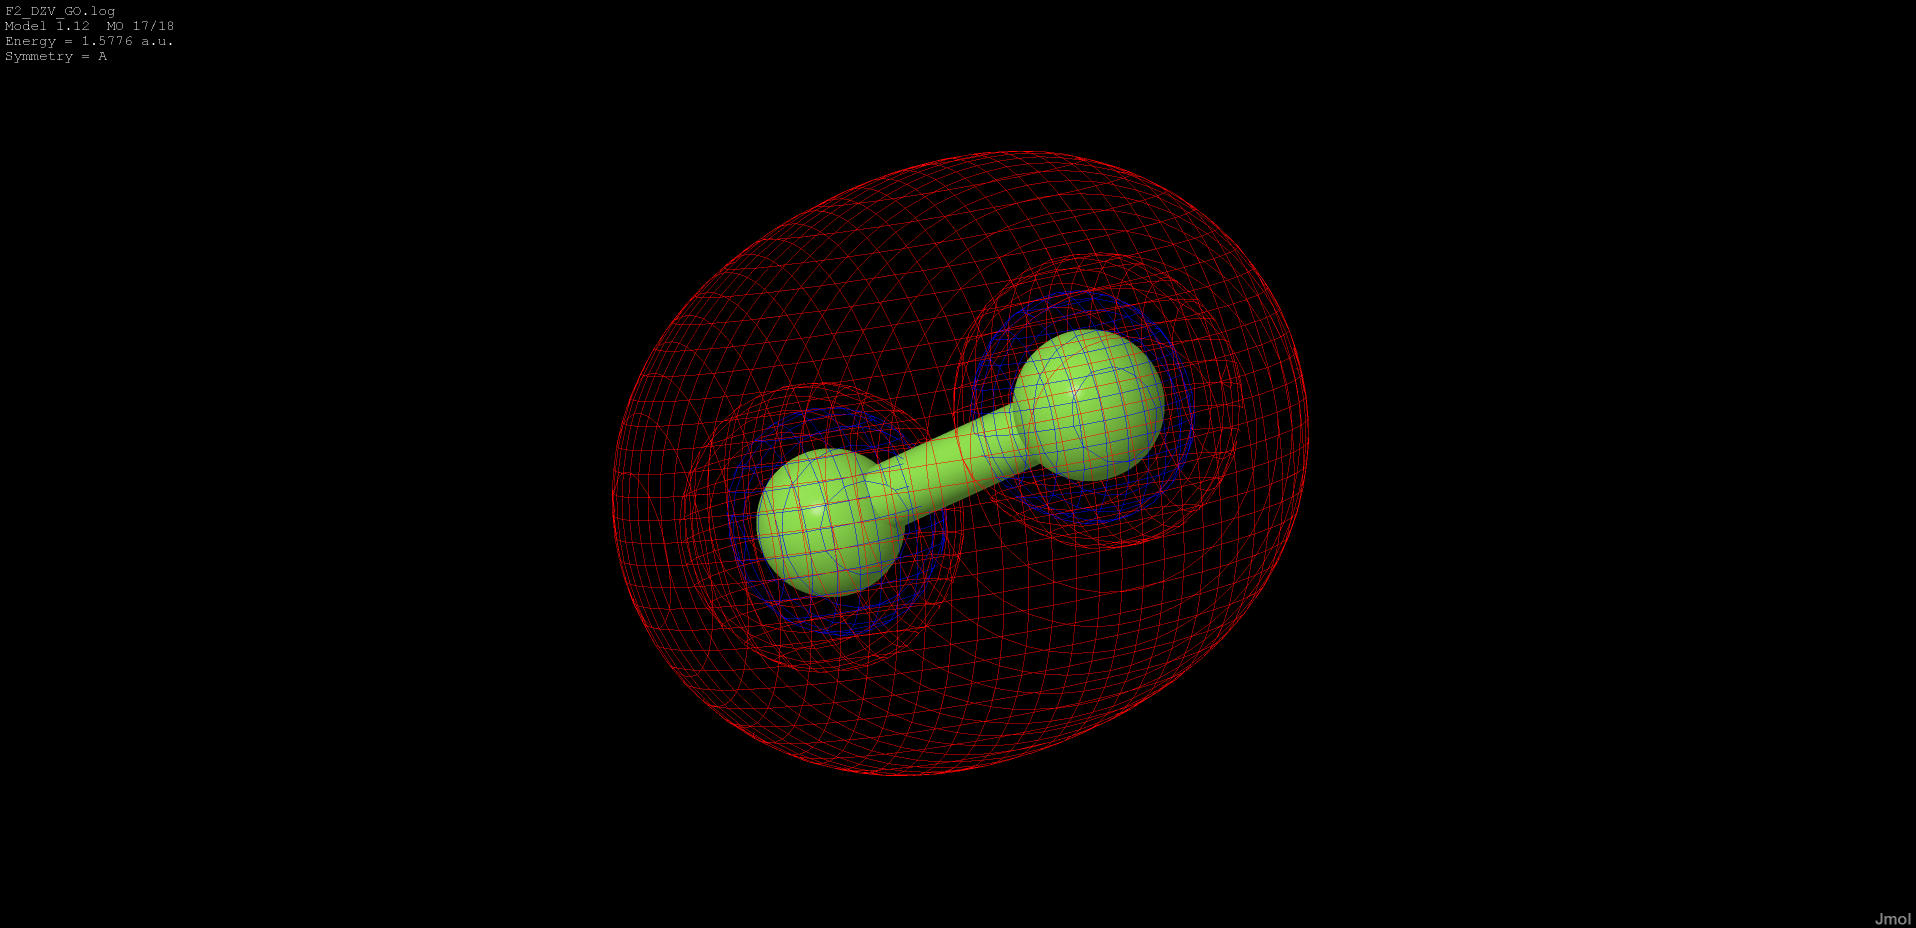 |
1.5776 |
anti-bonding |
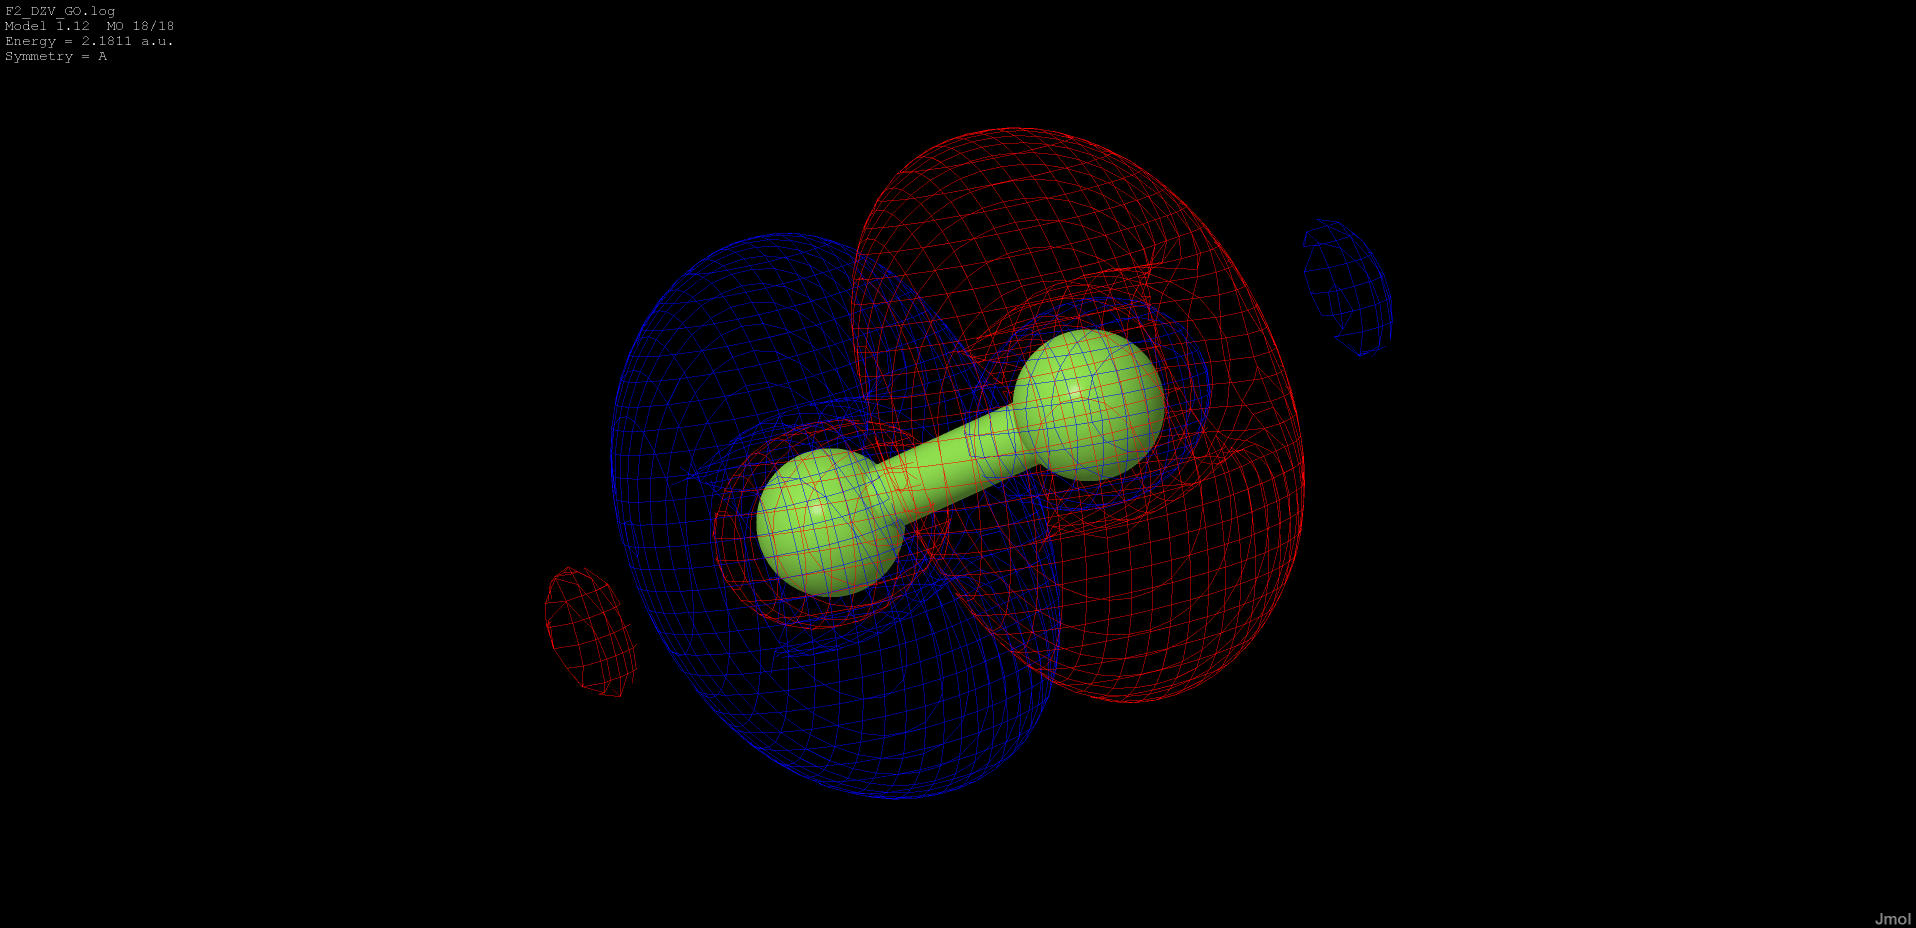 |
2.181 |
anti-bonding |
Figure
2 shows the relationship between potential
energy (PE) and bond length for different basis
sets.
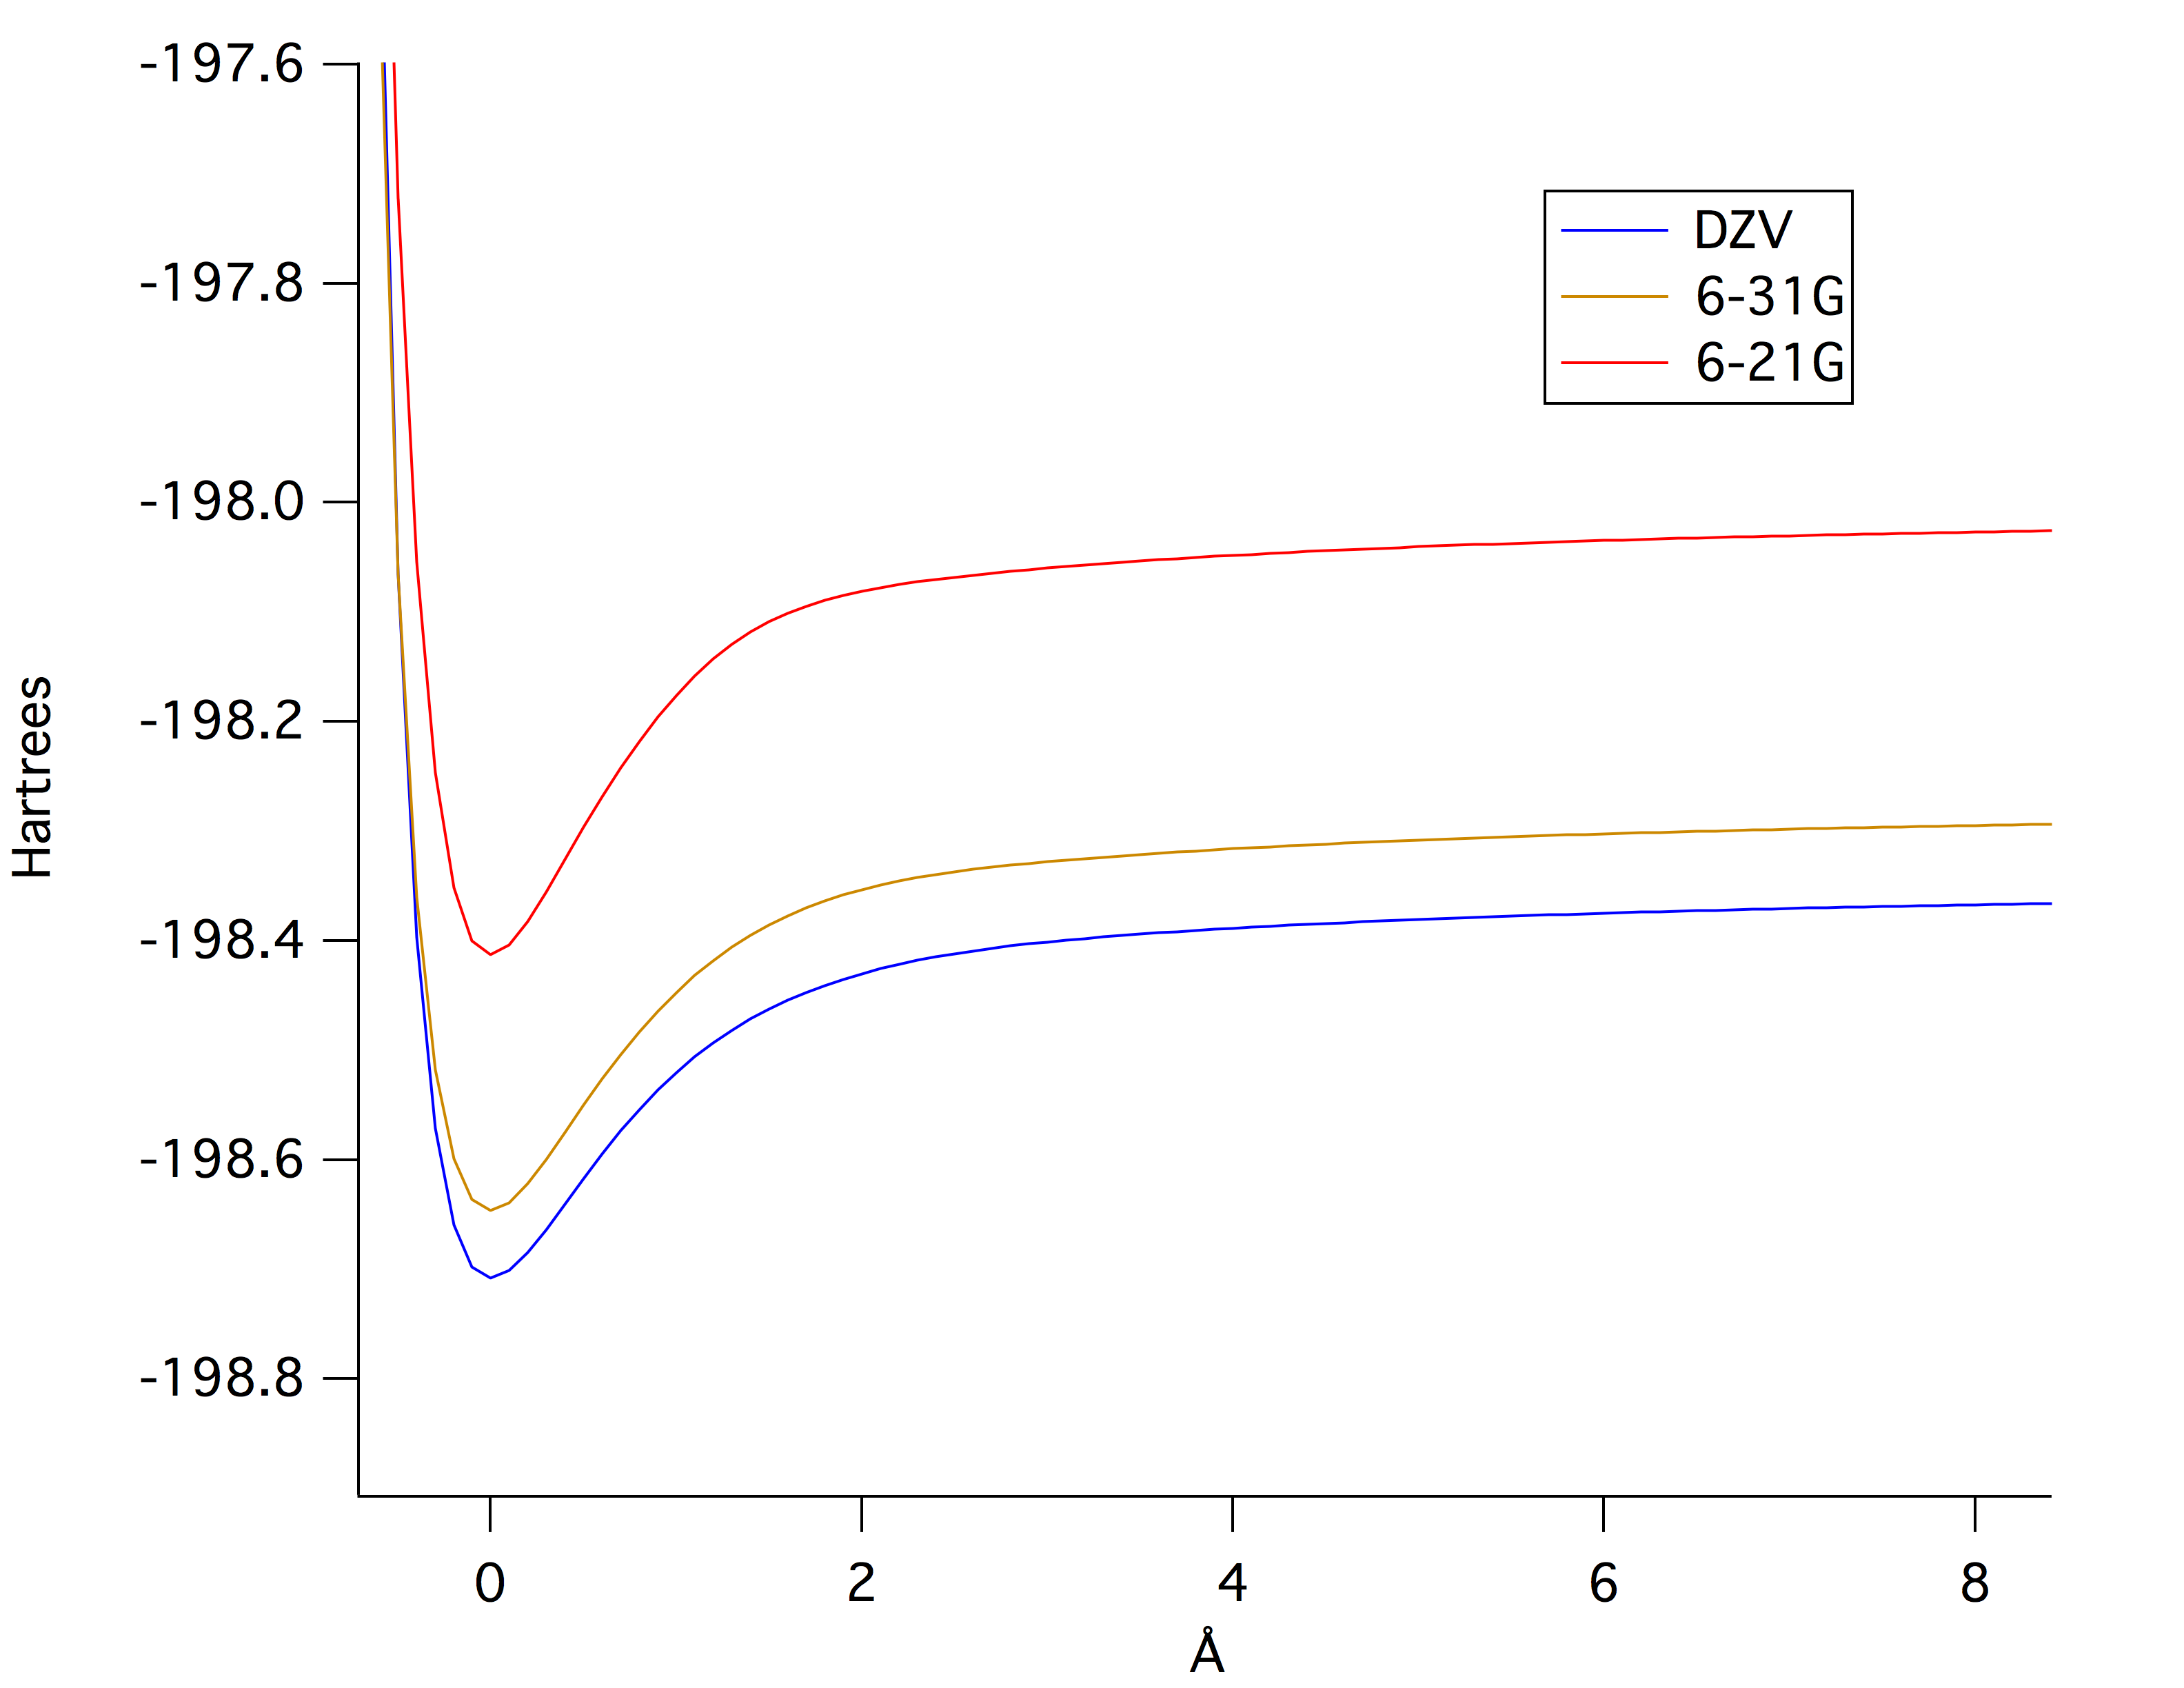
Figure 2. Comparison of Potential Energy versus Bond Stretching calculated using 6-21G, 6-31G, and DZV Level of Theory. Red line, upper line, represents calculated PE versus bond length for 6-21G. Yellow line, middle line, represents 6-31G calculations. Blue line, lower line represents DZV calculations.Despite having very little to no change in bond length calculated for the different levels if theory as shown in Table 1, there is an observable difference in calculated PE versus bond stretching for the various levels of theory. DZV level of theory, due to having a larger basis set, calculated a lower PE at different bond stretching which implies that the geometry of the molecule is more optimized compared to 6-21G and 6-31G geometry optimizations. Consequently, 6-21G, due to having a smaller basis set relative to DZV, calculated higher PE at various bond length, hence the least optimized.
Vibrational Frequencies
The stretching motion of F-F bond is shown, which is the primary vibrational motion that occurs for F2, specifically at 1131.7899 1/cm
|
|
HOME
Page
skeleton and JavaScript generated by export to web function
using Jmol 12.2.34
2012-08-09 20:37 on Mar 2, 2013.