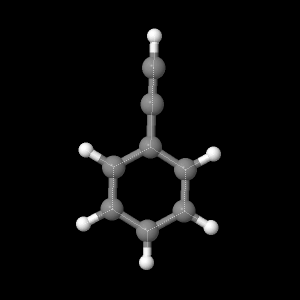
Optimized Geometries of the Phenylacetylene model were obtained using three different levels of theory, specifically 6-21G, 6-31G, and Double Zeta Valence (DZV). The Phenylacetylene model displayed on the right were made using DZV, the highest ab initio level of theory.
Bond lengths for Phenylacetylene are displayed using the button below.
|
|
Bond angles for Phenylacetylene are displayed using the button below.
|
|
Note here that bond lengths and bond angles gets relatively closer to the literature values as the level of theory was increased. Bond lengths and bond angles for the 6-21G and 6-31G basis sets are shown here.
Bond lengths and bond angles vary slightly compared to the literature values as shown from this link obtained from the NIST database.
The button below displays the HOMO of Phenylacetylene
|
|
The button below displays the LUMO of Phenylacetylene
|
|
The electrostatic potential of the molecule visually provides information about the charge distribution, polarity, and shape of the molecule . Red areas indicate high electron density. Blue areas indicate low electron density. The sizes of these regions vary depending on the differences in electronegativity of the molecules in the bond. The button below displays the electrostatic potential map for Phenyacytelene.
|
|
Moreover, the electronegativity of the constituents of the molecule indicate where partial charges are likely to be found. More electronegative atoms yield a more negative value and least electronegative atoms yield a more positive value. Note here that the greater the difference between partial charges within a molecule, the more polar the molecule. The button below shows the partial charges in Phenyacytelene
|
|
The Calculated dipole moment is shown in Table 5
Table 5. Dipole moment of Phenyacytelene
| DVZ (D) |
Literature (D) |
| 0.785 |
0.656 |
Vibrational Frequencies
Vibrational frequencies found at the NIST webpage and were compared to the data obtained using the DZV level of theory.
The following are displays of the said vibrational frequencies.
The button Vibrational Motion 1 displays vibrational motion of Phenyacytelene which corresponds to a vibrational frequency of 3396 1/cm.
|
|
The button Vibrational Motion 2 displays vibrational motion of Phenyacytelene which corresponds to a vibrational frequency of 1486 1/cm.
|
|
The button Vibrational Motion 3 displays vibrational motion of Phenyacytelene which corresponds to a vibrational frequency of 1363 1/cm.
|
|
The button Vibrational Motion 4 displays vibrational motion of Phenyacytelene which corresponds to a vibrational frequency of 1086 1/cm.
|
|
The button Vibrational Motion 5 displays vibrational motion of Phenyacytelene which corresponds to a vibrational frequency of 692 1/cm.
|
|
The button Vibrational Motion 6 displays vibrational motion of Phenyacytelene which corresponds to a vibrational frequency of 417 1/cm.
|
|
UV-Visible
The transition energy was found to be 207.522 nm using DZV level of theory. The literature value can be found by looking at the UV-Vis Spectrum of phenyacetylene found here
HOME
Page skeleton and JavaScript generated
by export to web function using Jmol 12.2.34
2012-08-09 20:37 on Mar 2, 2013.