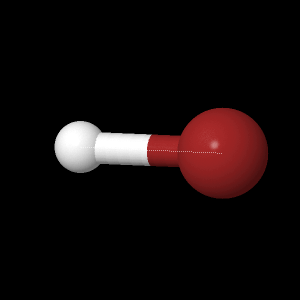
Once the molecule file is fully loaded, the image at right will become live. At that time the "activate 3-D" icon ![]() will disappear.
will disappear.
Hydrogen Bromide
Geometry optimizations were done to hydrogen bromide (HBr) first using two semi-empirical methods. Three ab initio
levels of calculations were then completed using the results of the
semi-empirical methods as their starting points. One of the pieces
of information that came from the geometry optimizations was the
calculated bond length. The
experimentally measured bond length is 0.14144 nm.1 It
was not necessary for bond angles to be calculated because HBr is
diatomic and therefore linear and does not have any bond angles.When calculations were done using AM1, the bond length was found to be 0.142 nm; this value is very close to the experimentally determined value . This geometry optimization was used as the starting point for all three ab initio geometry optimizations.
PM3 was the second semi-empirical method used. It gave the bond length, 0.147 nm, that differed the most of all of the calculated values from the experimental value.
3-21G was the lowest level of ab initio calculations used. 6-21G could not be used because it did not contain the correct orbitals to model bromine. The 3-21G level of theory gave a bond length that, at 0.143 nm, was closer to the experimental value than the PM3 calculated value, but further from the experimental value than the AM1 calculated value.
6-31G was the next level used. The bond length that it gave, 0.142 nm, matched the value that came from the AM1 calculations and was also very close to the experimentally determined bond length.
The last basis set that was used was DZV. A value of 0.142 nm was found for the bond length, which matches the bond lengths calculated by AM1 and 6-31G and is very close to the experimentally determined bond length.
The highest occupied molecular orbital (HOMO) was found by calculating the total number of electrons in HBr, 36 electrons, and dividing by two, since by the Pauli exclusion principle, there can be two electrons per orbital. Therefore, orbital 18 is the HOMO. This orbital is degenerate with orbital 17; both have an energy of -0.4349 a.u. The results of the geometry optimization using DZV were used to generate the orbitals and calculate their energies.
The lowest unoccupied molecular orbital (LUMO) is the orbital that is next highest in energy after the HOMO. For HBr, the LUMO is orbital 19. It has an energy of 0.1362 a.u. The results of the geometry optimization using DZV were also used to generate the orbital and calculate its energy.
A molecular orbital diagram shown in figure 1 was generated for HBr, showing all of the orbitals, their relative energies, and how the electrons were placed was constructed from the energies and orbital shapes given by the DZV geometry optimization.
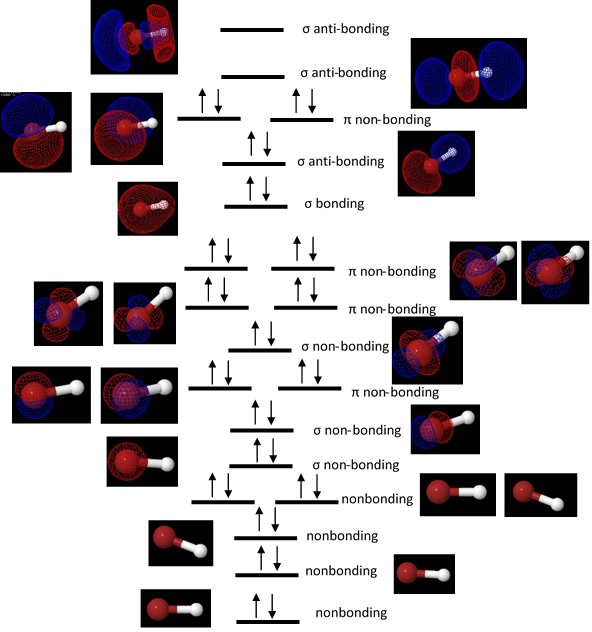
Figure 1. A molecular orbital diagram for HBr. Each molecular orbital is depicted at its relative energy level, and the orbitals were assigned sigma or pi designations based on the their symmetries and were classified as bonding, antibonding, or nonbonding orbitals based on where they were located on the molecule.
A map of the molecular electrostatic potential as calculated using DZV was made on the molecular surface. The blue areas have the highest electrostatic potential, indicating that electrons are less likely to be in that area. The red areas have the lowest electrostatic potential and, therefore, are more likely to have electrons present.
In this view, the hydrogen and bromine atoms are labeled with their respective partial atomic charges.
The potential energy of bond stretching was calculated
using the 3-21G, 6-31G, and DZV levels of theory shown in figure 2. For all of
them, there was an initial decrease in energy to a low value, and then
the potential energy increased slightly as the bond length increased
more. The lowest energy conformation is the one that is considered
to be best for the molecule. It was expected that the DZV level
would give the lowest
energy values overall because it has the largest basis set and should
have done the best geometry optimization; however, the values from 6-31G
are lower by slightly over 2 Hartrees, indicating that this level of
theory produced a better
geometry. 3-21G is higher in energy than DZV by approximately 10
Hartrees, so it is the worst of the three at calculating the correct
geometry. This makes sense because it has the smallest basis
set. One potential reason for the superior performance of 6-31G
over DZV is that the basis set of 6-31G could include more of the
orbitals that are
useful for bromine.
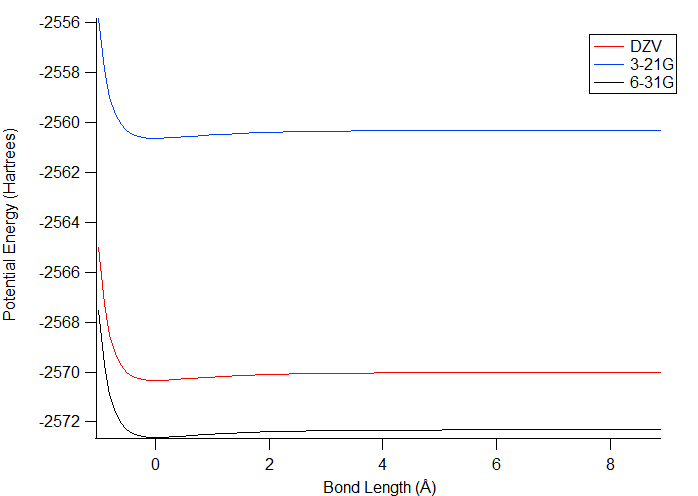
Figure 2. Plot of the potential energy of bond stretching. The energies were calculated when the atoms were different distances apart. The lower the energy is, the better the conformation is.
The experimental dipole moment for HBr is 0.827 Debye.1 Using the initial geometry optimizations, the calculated value that got closest to matching the experimental value was 1.267011 Debye from PM3. This is interesting because the PM3 bond length was the furthest of all of the calculated bond lengths from the experimental bond length.
Further calculations with 3-21G, 6-31G, and DZV using diffuse orbitals were done in order to optimize the dipole moment. The dipole moments that were the closest to the experimental value for each level of theory are listed in Table 1 along with the specifications of the diffuse orbitals that were used. The changes that were made include the number of D heavy atom polarization, the number of F heavy atom polarization, and the number of light atom polarization.
Table 1. Dipole moments after optimization using diffuse orbitals. The values for the diffuse orbitals correspond to the number of D heavy atom polarization, the number of F heavy atom polarization, and the number of light atom polarization.
| theory | 3-21G |
6-31G |
DZV |
| diffuse orbitals |
2,0,3 |
3,1,0 |
2,1,3 |
| dipole moment (Debye) |
0.831323 |
0.938224 |
0.932778 |
The 3-21G level of theory provided the calculated dipole that was the closest to the experimental value, which was not expected because it contains the smallest basis set. There was very little pattern to the way in which the variation of each of the three parameters affected the calculated value of the dipole moment within one level of theory.
The vibration frequency of HBr was also calculated using the DZV geometry optimization and was found to be 2635.8 cm-1. This value is close to the experimental value of 2649 cm-1, which amounts to an error of 0.5%.
You may look at any of these intermediate views again by clicking on the appropriate button.
Page skeleton and JavaScript generated by export to web function using Jmol 14.2.15_2015.07.09 2015-07-09 22:22 on Mar 2, 2016.
This will be the viewer
If your browser/OS combination is Java capable, you will get snappier performance if you use Java