Methanol, CH3OH
Models were made using the best ab initio
level of theory, which was 6311-G. This is the best level because
it is the biggest basis set for the molecule.
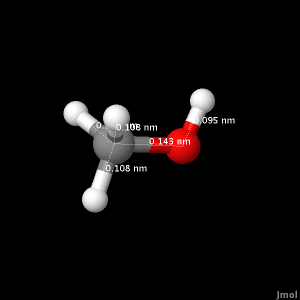
Click below to view CH3OH bond lengths.
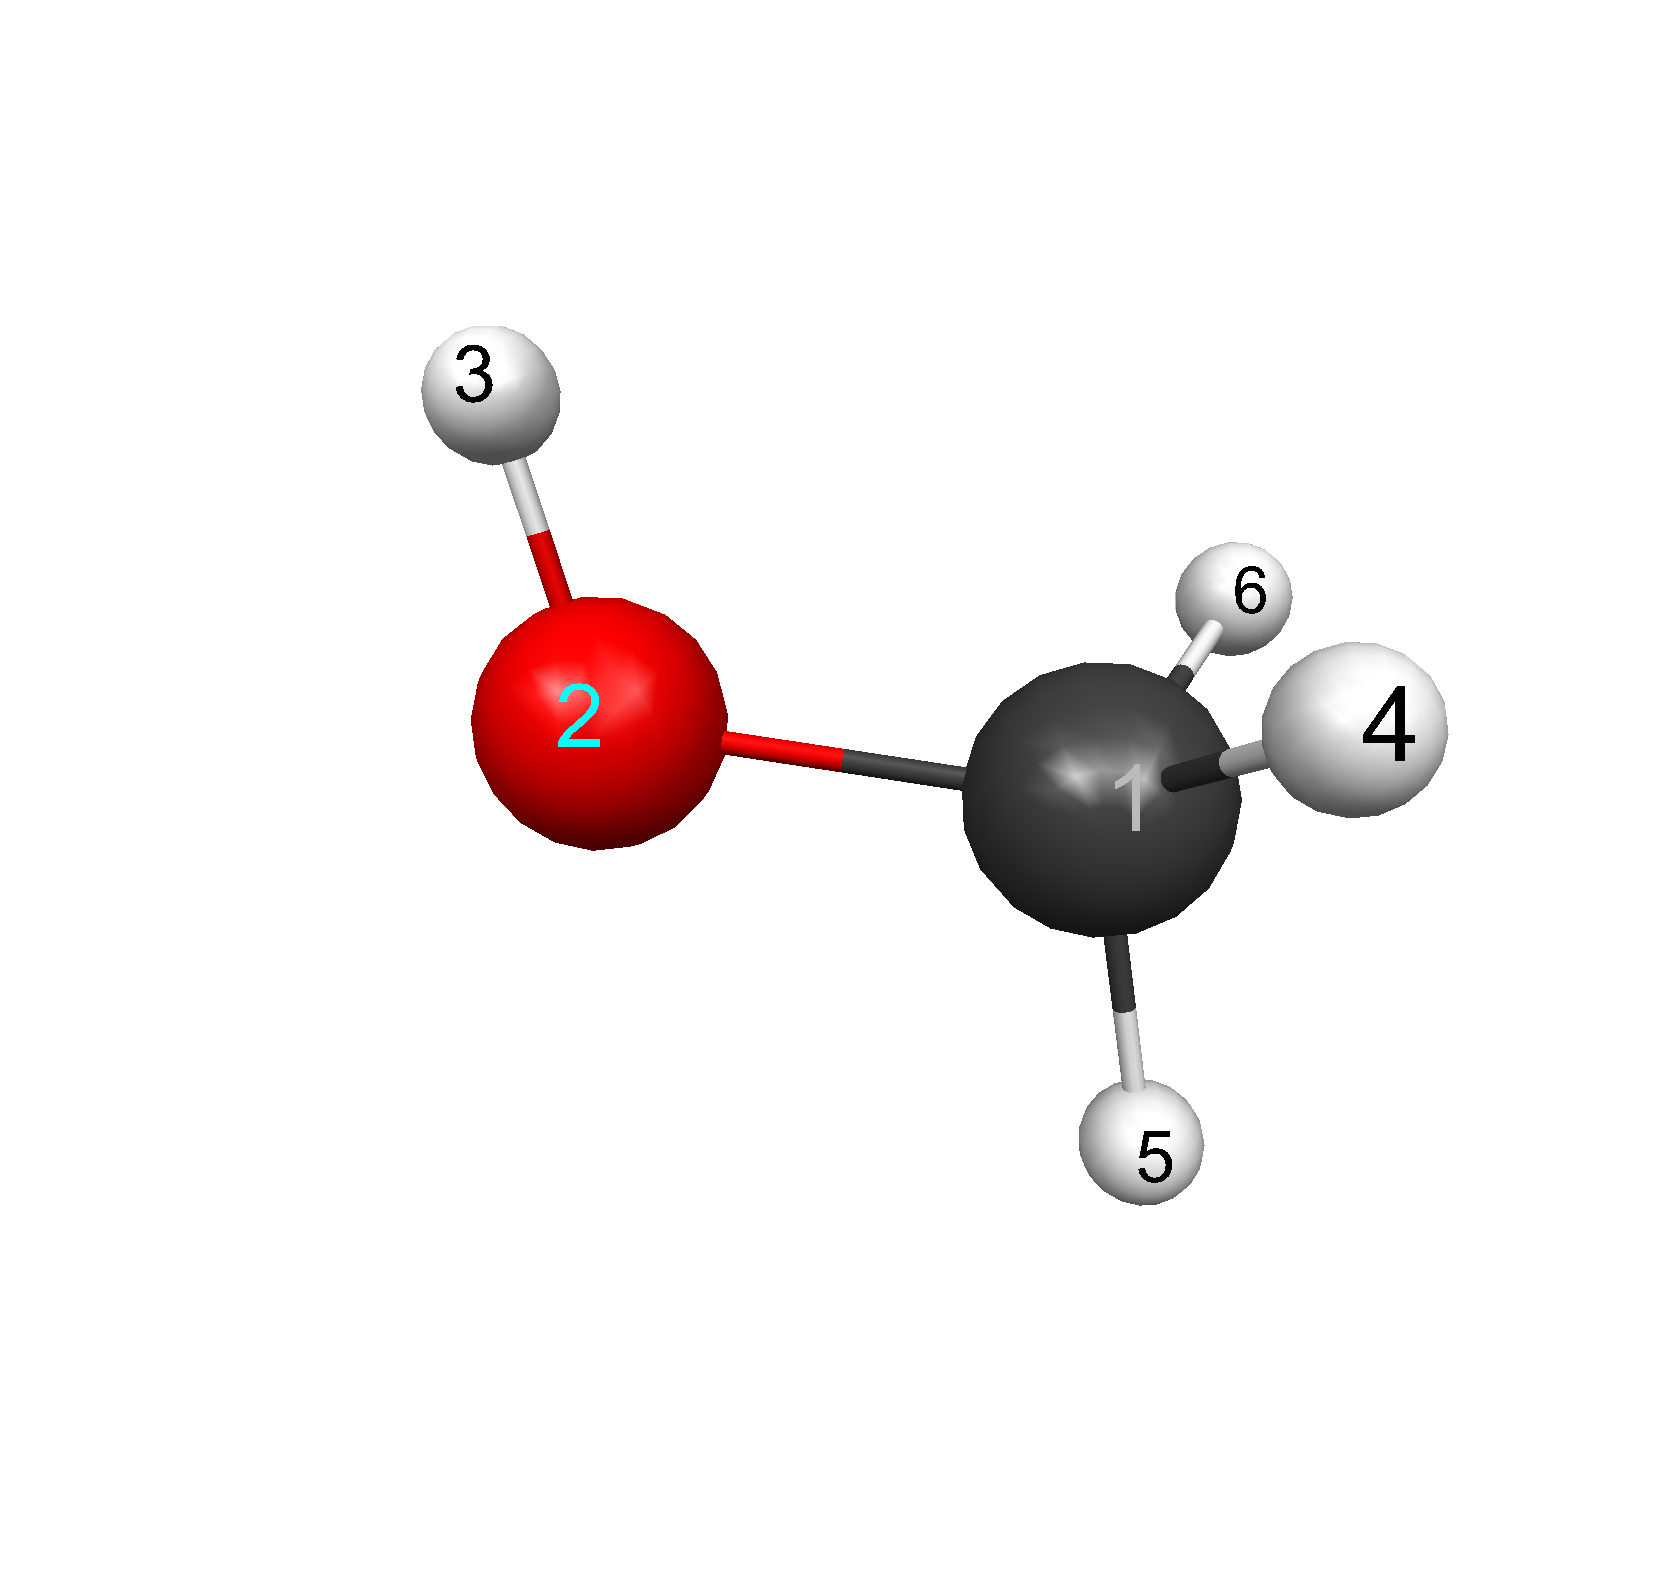 |
Figure 1: CH3OH: (1)C, (2)O, (3)H, (4)H, (5)H, (6)H
Bond lengths of CH3OH were found using the Hamiltonians and three ab initio levels. Bond
lengths for atoms (1)C, (2)O, (3)H, (4)H, (5)H, (6)H in angstroms, Å,
at the different levels of theory, see Figure 1. Methanol
had three literature bond lengths which were C-H 1.096 Å, C-O 1.427 Å,
and O-H 0.956 Å.1
| Atoms | PM3 | AM1 | 321-G | 631-G | 6311-G |
| 1-2 | 1.394818 | 1.410427 | 1.440943 | 1.430507 | 1.428506 |
| 1-4 | 1.097026 | 1.118675 | 1.085102 | 1.083560 | 1.082426 |
| 1-5 | 1.093556 | 1.118997 | 1.078644 | 1.076815 | 1.075128 |
| 1-6 | 1.097016 | 1.118669 | 1.085122 | 1.083586 | 1.082428 |
| 2-3 | 0.948750 | 0.964087 | 0.965792 | 0.950207 | 0.946021 |
Click the button below to see CH3OH bond angles, H-C-H and H-O-C.
Click the button below to see CH3OH bond angles, O-C-H.
Bond angles
for atoms (1)C, (2)O, (3)H, (4)H, (5)H, (6)H in degrees, °, at the
different levels of theory, see Figure 1. Methanol had
experimental bond angles of H-C-H 109.03° and H-O-C 108.87°.1
| Atoms | PM3 | AM1 | 321-G | 631-G | 6311-G |
| 1-2-3 | 107.45 | 107.17 | 110.34 | 113.42 | 113.17 |
| 4-1-6 | 109.03 | 109.68 | 108.75 | 109.24 | 109.18 |
| 4-1-5 | 109.44 | 110.03 | 108.61 | 108.99 | 108.90 |
| 6-1-5 | 109.45 | 110.04 | 108.60 | 108.98 | 108.90 |
| 4-1-2 | 112.15 | 110.94 | 112.24 | 111.65 | 111.62 |
| 5-1-2 | 104.49 | 105.13 | 106.28 | 106.25 | 106.53 |
| 6-1-2 | 112.16 | 110.94 | 112.23 | 111.64 | 111.62 |
Click below to view the CH3OH
HOMO orbital. The HOMO orbital is the highest energy molecular
orbital occupied by electrons. From the model, it can be
predicted how a molecule will react.
Vibrational Frequencies
Click below to see the motion of the molecule at frequency 1116 cm-1. This contributes to ~1000 cm-1 peak in the IR spectrum. 2
Click below to see the motion of the molecule at frequency 1469 cm-1. This contributes to ~1400 cm-1 peak in the IR spectrum. 2
The next three frequencies contribute to the ~3000 cm-1 peak in the IR spectrum. 2 Click below to see the motion of the molecule at frequency 3156 cm-1.
Click below to see the motion of the molecule at frequency 3211 cm-1.
Click below to see the motion of the molecule at frequency 3305 cm-1.
Click below to see the motion of the molecule at frequency 4043 cm-1. This contributes to ~3600 cm-1 peak in the IR spectrum. 2
Dipole moments at each level of theory for CH3OH. Experimental 1.70 D.3
| Theory Level | Dipole (D) |
| PM3 | 1.621053 |
| AM1 | 1.487285 |
| 321-G | 2.121482 |
| 631-G | 2.285451 |
| 6311-G | 2.253251 |
References:
(1) http://cccbdb.nist.gov/ . Geometries. Experimental geometry data for a given species. CH3OH.
(2) http://webbook.nist.gov/. IR spectrum of CH3OH.
(3) Lide, D. R. CRC Handbook of Chemistry and Physics; CRC Press: Boca Raton, 1992.
Page skeleton and JavaScript generated by export to web function using Jmol 11.6.6 2008-09-20 22:06 on Mar 18, 2009.