Aniline,
C6H5NH2
Models were made using
the best ab initio
level of theory, which was 6311-G. This is the best level
because
it is the biggest basis set for the molecule. Click below
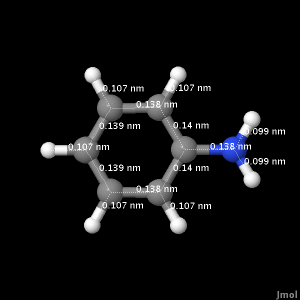
for aniline bond lengths.
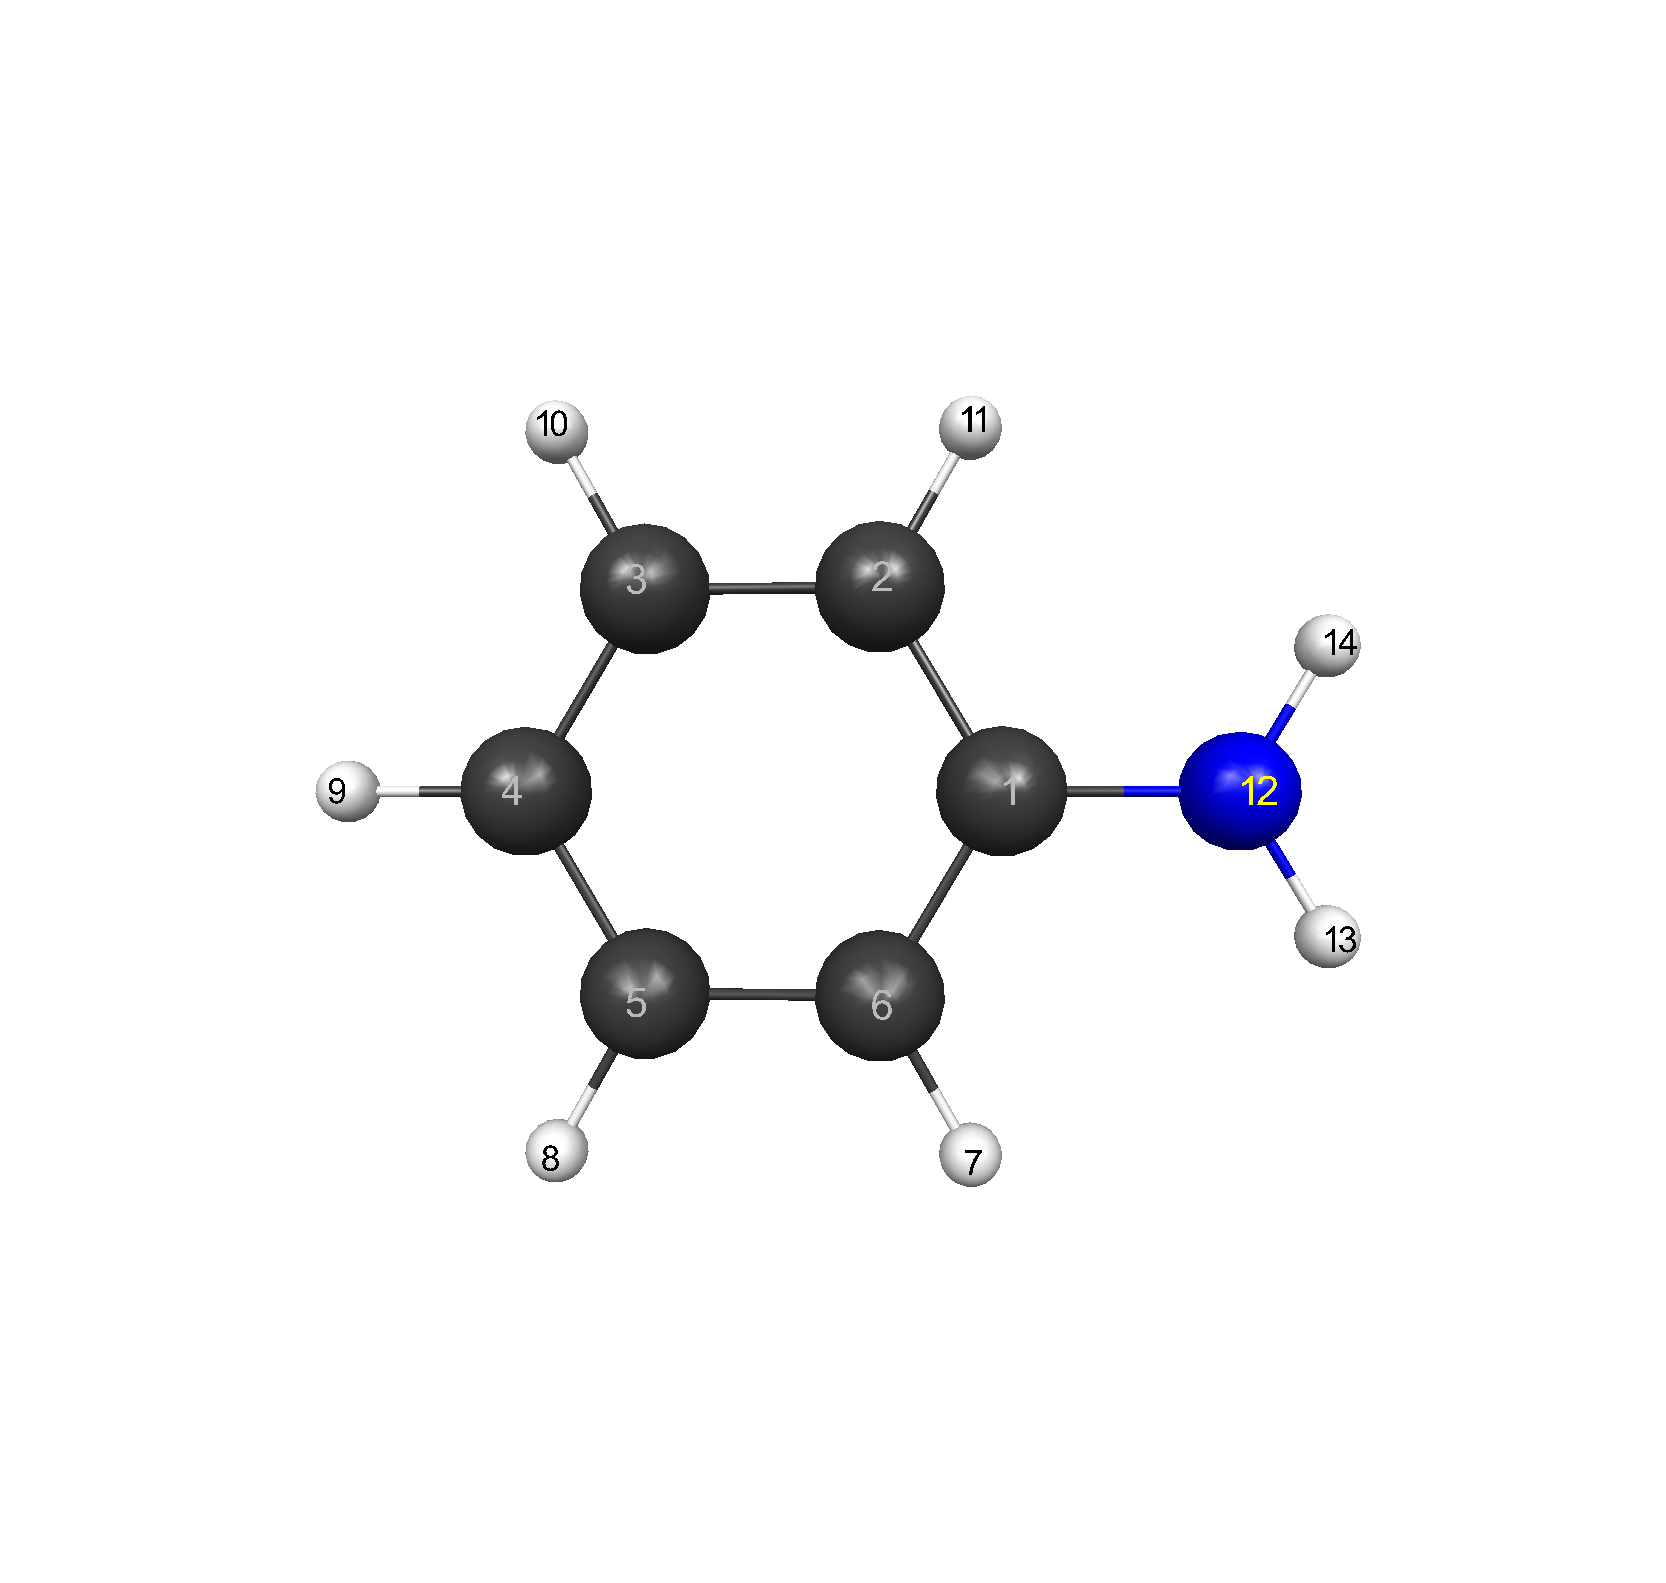 |
Figure 1: C6H5NH2: (1)C, (2)C, (3)C, (4)C, (5)C, (6)C, (7)H, (8)H, (9)H,
(10)H, (11)H, (12)N, (13)H, (14)H.
Bond lengths for atoms (1)C, (2)C, (3)C, (4)C, (5)C, (6)C, (7)H, (8)H, (9)H, (10)H, (11)H, (12)N, (13)H, (14)H in angstroms, Å, at the different levels of theory.
The experimental values were C-H 1.084 Å, C-C 1.392 Å, and C-N 1.431 Å.1
| Atoms | PM3 | AM1 | 321-G | 631-G | 6311-G |
| 1-2 | 1.402123 | 1.414806 | 1.395290 | 1.397001 | 1.396503 |
| 1-6 | 1.402087 | 1.414810 | 1.395298 | 1.396984 | 1.396505 |
| 1-12 | 1.429962 | 1.399938 | 1.376384 | 1.380452 | 1.381926 |
| 2-3 | 1.388584 | 1.390066 | 1.380267 | 1.384708 | 1.384094 |
| 2-11 | 1.096318 | 1.099924 | 1.072553 | 1.074170 | 1.071858 |
| 3-4 | 1.390950 | 1.394044 | 1.384180 | 1.387937 | 1.387465 |
| 3-10 | 1.094956 | 1.100514 | 1.072639 | 1.073712 | 1.071441 |
| 4-5 | 1.390967 | 1.394053 | 1.384201 | 1.387926 | 1.387465 |
| 4-9 | 1.094357 | 1.098574 | 1.071023 | 1.072262 | 1.069927 |
| 5-6 | 1.388581 | 1.390077 | 1.380268 | 1.384710 | 1.384097 |
| 5-8 | 1.094954 | 1.100513 | 1.072642 | 1.073710 | 1.071438 |
| 6-7 | 1.096331 | 1.099924 | 1.072618 | 1.074192 | 1.071858 |
| 12-13 | 0.995849 | 0.995952 | 0.994508 | 0.988952 | 0.986486 |
| 12-14 | 0.995849 | 0.995913 | 0.994526 | 0.988954 | 0.986498 |
Click below for Aniline
angles, C-C-H and C-N-H.
Click below for Aniline
Angles, C-C-C.
Bond angles between atoms (1)C, (2)C, (3)C, (4)C, (5)C, (6)C, (7)H, (8)H, (9)H, (10)H, (11)H, (12)N, (13)H, (14)H in degrees, °, at the different levels of theory. The experiemental values are H-N-H 113.9°, H-N-C 114.92°. 1
| Atoms | PM3 | AM1 | 321-G | 631-G | 6311-G |
| 1-12-13 | 111.58 | 114.18 | 120.95 | 121.07 | 121.02 |
| 1-12-14 | 111.58 | 114.19 | 120.95 | 121.07 | 121.02 |
| 14-12-13 | 111.05 | 113.08 | 118.10 | 117.86 | 117.97 |
| 12-1-6 | 120.05 | 120.71 | 120.95 | 120.69 | 120.71 |
| 12-1-2 | 120.02 | 120.72 | 120.95 | 120.69 | 120.71 |
| 1-2-3 | 119.73 | 120.29 | 120.69 | 120.40 | 120.43 |
| 2-3-4 | 120.46 | 120.74 | 120.95 | 120.91 | 120.93 |
| 3-4-5 | 119.85 | 119.48 | 118.62 | 118.76 | 118.71 |
| 4-5-6 | 120.45 | 120.74 | 120.94 | 120.90 | 120.93 |
| 5-6-1 | 119.77 | 120.29 | 120.70 | 120.41 | 120.43 |
| 6-1-2 | 119.74 | 118.46 | 118.10 | 118.62 | 118.57 |
| 1-6-7 | 120.65 | 120.14 | 119.38 | 119.55 | 119.53 |
| 1-2-11 | 120.66 | 120.13 | 119.38 | 119.54 | 119.53 |
| 11-2-3 | 119.61 | 119.57 | 119.94 | 120.06 | 120.04 |
| 2-3-10 | 119.67 | 119.40 | 119.11 | 119.16 | 119.14 |
| 10-3-4 | 119.87 | 119.86 | 119.93 | 119.94 | 119.92 |
| 3-4-9 | 120.08 | 120.26 | 120.70 | 120.61 | 120.65 |
| 9-4-5 | 120.07 | 120.26 | 120.68 | 120.63 | 120.65 |
| 4-5-8 | 119.88 | 119.85 | 119.93 | 119.93 | 119.92 |
| 8-5-6 | 119.67 | 119.41 | 119.13 | 119.17 | 119.14 |
| 5-6-7 | 119.61 | 119.57 | 119.93 | 120.05 | 120.04 |
Click
below to view the Aniline HOMO orbital. The HOMO orbital is
the
highest energy molecular orbital occupied by
electrons.
From the model, it can be predicted how a molecule will
react.
Vibrational Frequencies
The next two frequencies
contribute to the ~3400 cm-1 peak in the IR
spectrum. 2
Click below to see the motion of the molecule at frequency 3993 cm-1.
Click below to see the
motion of the molecule at frequency 3851 cm-1.
The next five frequencies contribute to the ~3000 cm-1 peak in the IR spectrum. 2 Click below to see the motion of the molecule at frequency 3380 cm-1.
Click below to see the
motion of the molecule at frequency 3354 cm-1.
Click below to see the
motion of the molecule at frequency 3333 cm-1.
Click below to see the
motion of the molecule at frequency 3329 cm-1.
Click below to see the
motion of the molecule at frequency 3305 cm-1.
Click below to see the
motion of the molecule at frequency 1839 cm-1.
This contributes to ~1600 cm-1 peak in the IR
spectrum. 2
Click below to see the
motion of the molecule at frequency 1785 cm-1.
This contributes to the motion of the ring.
Click below to see the
motion of the molecule at frequency 1216 cm-1.
This is a different motion that also contributes to the ring.
Dipole moments at each
level of theory for aniline. The experimental value is 1.13 D.3
| Theory Level | Dipole (D) |
| PM3 | 1.541795 |
| AM1 | 1.296054 |
| 321-G | 1.627040 |
| 631-G | 1.455966 |
| 6311-G | 1.530404 |
UV/Vis
References:Transition energies were
found in the 321-G and 631-G ab
initio levels. Transition energies (nm) were
compared to the experimental values, by viewing the UV/Vis
spectrum.
For the highest oscillator strength, which is the greatest
intensity, the transition energy in 321-G is 145.63 nm, and in 631-G
the transition energy is 148.066 nm. These values do not correspond to
experimental values.4
(1) http://cccbdb.nist.gov/ . Geometries. Experimental geometry data for a given species. aniline.
(2) http://webbook.nist.gov/. IR spectrum of aniline.
(3) Lide, D. R. CRC Handbook of Chemistry and Physics; CRC Press: Boca Raton, 1992.
(4) http://webbook.nist.gov/. UV/Vis spectrum of aniline.
Page
skeleton and JavaScript generated by export to web function using Jmol 11.6.6 2008-09-20
22:06 on Mar 18, 2009.