Once the molecule file is fully
loaded, the image at right will become live. At that time the
"activate 3-D" icon ![]() will disappear.
will disappear.
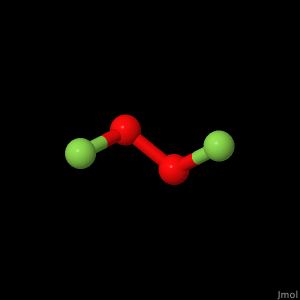
FOOF Vibrational Frequencies
Using DZV
theory, several significant vibrational frequencies were
predicted. Each of the buttons below represents the
vibrational frequency displayed.
Shown below is an IR spectra of the only
known experiment to perform this analysis5.
In the three graphs which plot intensity vs. wavenumber,
there is a strong signal between 1250-1300 cm-1 depending
on the isotope of oxygen used. In the DZV calculations,
there was no signal in this range, with the closest
being at 1077.92 cm-1. This is further
evidence that even higher levels of theory do not always
make the best predictions.

Figure 1: IR Spectra of FOOF
Using Various Oxygen Isotopes
Page skeleton and
JavaScript generated by the Export to Web module of Jmol 14.29.46 2019-06-03
12:50 on Oct 9, 2019.
If your browser/OS combination is Java capable, you will get snappier performance if you use Java