Quantum Calculations of Cl2O2

Jmol0 will appear here.
Figure 1: Interactive model of Cl2O2 with bond lengths calculated from the DZV basis set using RHF SCF. Click on image to interact with the 3D model.
The results of the calculations performed in the experiment are shown and discussed here.

Bond lengths at each level of theory studied are listed below in Table 1 and an interactive model of the molecule with bond lengths displayed is shown in Figure 1.

Table 1: Calculated and experimentally determined bond lengths of Cl2O2 at different levels of theory and basis sets using the RHF SCF.
Theory
Cl-O Bond Length (nm)
O-O Bond Length (nm)
PM3
0.168
0.145
AM1
0.168
0.145
6-21G
0.180
0.119
6-31G
0.177
0.145
DZV
0.178
0.142
Experimental2
0.1704
0.1426

Jmol1 will appear here.


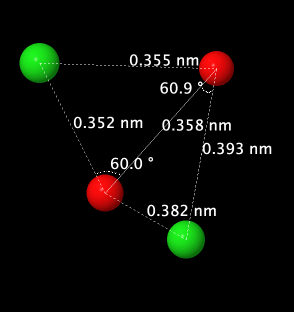
Figure 2: Interactive model of Cl2O2 with bond angles calculated from the DZV basis set using RHF SCF. Click on image to interact with the 3D model.
Figure 3: Image of the Cl2O2 geometry calculated from the ab initio DZV basis set using UHF style SCF.

Bond angles at each level of theory studied are listed below in Table 2 and an interactive model of the molecule with bond lengths displayed is shown in Figure 2.

Table 2: Calculated and experimentally determined bond angles of Cl2O2 at different levels of theory and basis sets using the RHF SCF.
Theory
Cl-O-O Bond Angle
Cl-O-O-Cl Bond Angle
PM3
110.7 °
107.3 °
AM1
110.7 ° 107.3 °
6-21G
115.6 ° 88.0 °
6-31G
107.9 ° 96.3 °
DZV
109.8 ° 93.9 °
Experimental2
110.07 ° 81.03 °

Bond lengths and angles are were not reported for the UHF SCF type because at every level of theory and basis set, the atoms of the molecule were "blown apart" (Figure 3). For the levels of theory and basis sets that used the RHF type SCF, the semi-empirical AM1 method produced the bond lengths closest to the experimental values. However, the dihedral bond angle from the AM1 calculations was the furthest from experimental values. At the ab initio level of theory, the DZV basis set provided the bond lengths and angles closest to the reported experimental values. Since the DZV optimization provided geometries that were closest to the experimental values, these were used to determine several characteristics of the Cl2O2 molecule including the HOMO, LUMO, partial atomic charges, and the electrostatic potential.
Jmol2 will appear here.
Jmol3 will appear here.
Figure 4: Interactive model of Cl2O2 with the HOMO (left) and LUMO (right) displayed. Molecular orbitals shown were calculated from the DZV basis set. Click on image to interact with the 3D model.
Interactive models of the HOMO and LUMO are show in Figure 4. The HOMO posses mostly anti-bonding orbitals however, the angles between the orbitals appears to be offset slightly. The offset angles reduces the amount of anti-bonding interactions between the chlorine atoms and their respective oxygen neighbors which lowers the energy of the orbital.

In contrast to the HOMO, the LUMO of Cl2O2 has clear nodes between the chlorine atoms and their respective oxygen neighbors that raises the energy of the molecular orbital. The nodes are evident due to the flattened and distorted shape of the orbitals on either side of the node. The orbitals of the oxygen atoms on the LUMO also appear distorted by interactions with each other. Interestingly, the oxygen orbitals are stretched in the direction of the neighboring oxygen orbital with the same polarity. This suggests that there may be some bonding character present between the oxygen orbitals.

Interactive models of the Cl2O2 molecule with calculated partial atomic charges and electrostatic potential are shown in Figure 5 and Figure 6 respectively. Although small, the partial charges and electrostatic potential both show that the oxygen atoms posses a slight negative charge while the chlorine atoms are slightly positive. This is consistent with the relative electronegativity of the two types of atoms, oxygen is more electonegative than chlorine and thus has slightly more electron density around it.
Jmol4 will appear here.

Jmol5 will appear here.
Figure 5: Interactive model of Cl2O2 with calculated partial atomic charges. Partial charges were calculated using the DZV optimization. Click on image to interact with the 3D model.   
Figure 6: Interactive model of Cl2O2 with the molecular electrostatic potential mapped over the surface. Click on image to interact with the 3D model.
Dipole moments were calculated at each level of theory and basis set and are listed in Table 3. In the molecular geometry calculations, the semi-empirical AM1 method generated the best bond lengths and Cl-O-O bond angle but that same calculation produced the dipole furthest from the experimental value. For dipole moment, the PM3 method gave the value closest to experimental. Polarization functions were performed based on the DZV calculation but showed no change in the dipole moment for the conditions where the GAMESS was able to successfully complete the calculation.

Table 3: Calculated and experimentally determined dipole moments for Cl2O2.
Theory
Dipole Moment (Debye)
PM3
1.395242
AM1
0.025443
6-21G
0.999123
6-31G
1.414950
DZV
1.487315
Experimental2
1.349

The vibration frequencies of the Cl2O2 molecule were calculated from the DZV basis set and are found here.
Page skeleton and JavaScript generated by the Export to Web module of Jmol 14.29.46 2019-06-03 12:50 on Oct 3, 2019.
Based on a template by A. Herráez and J. Gutow