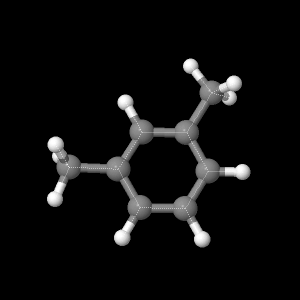
Once the molecule file is fully
loaded, the image at right will become live. At that time the
"activate 3-D" icon will disappear.
Meta-xylene (CH3C6H4CH3)
The geometry optimizations for the three highest levels of
theory are shown below. The following buttons show the bond
lengths and angles for each theory.8
6-21G was the lowest level of theory used for geometry
optimization.
6-31G was the next highest level of theory used for geometry
optimization.
DZV was the highest level of theory used for geometry
optimization.
This is the highest occupied molecular orbital at orbital 29.
The orbitals were calculated by summing the amount of electrons
in the molecule and dividing by two.
This is the lowest unoccupied molecular orbital at orbital
30. This would become occupied if the molecule was excited
with an adequate amount of energy.
This is the electrostatic potential of the molecule. The red
areas represent the lowest potentials and blue represent the
highest potentials. Intermediate colors represent intermediate
potentials.
The partial atomic charge on each atom is shown here. They are
created by the asymmetric distribution of electrons in a
chemical bond.
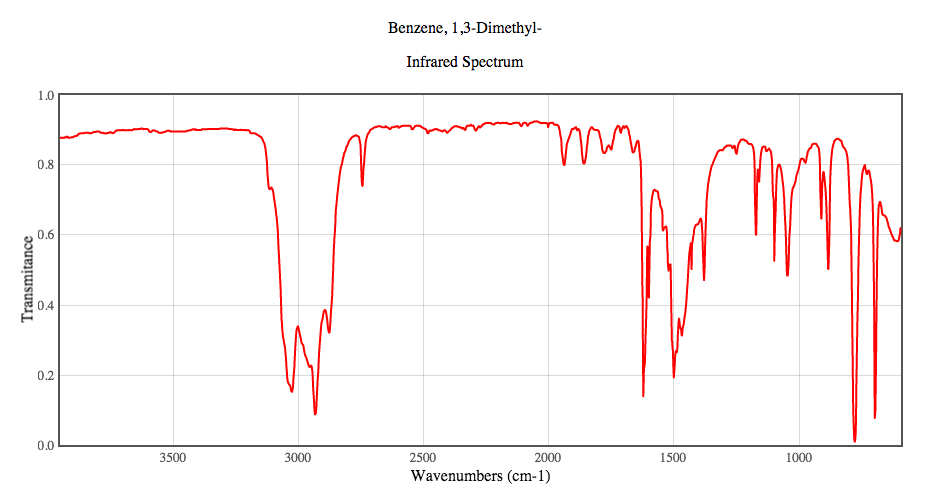
The vibrational frequencies were calculated using the highest
level of theory. These vibrations would appear in an infrared
spectrum of meta-xylene. Figure 1 shows the literature IR
spectrum of this molecule.9
Figure 1: IR spectrum of meta-xylene. Note that the
molecule can be named multiple ways, as the title suggests.
The following buttons can help visualize certain diagnostic
peaks in the IR. The important ring stretches appear in the
2000-1650 cm-1 and 900-600 cm-1 regions
which help determine the substitution patterns of benzene
molecules.
The UV peaks on UV-Vis spectrum were
calculated and are shown in Table 1. No experimental data
was found for meta-xylene so comparison was not able to be
accomplished.
Table 1: Tabulated values for peaks on a UV-Vis
spectra. The oscillator strength shows the probability of
that peak being on the graph.
Oscillator strength
Wavelength (nm)
0.004766
200.2
0.005739
194.8
0.007580
190.5
Due to the relative weak dipole moments between carbon and
hydrogen, dipole moment calculations were not included.
You may look at any of these intermediate views again by
clicking on the appropriate button.
Based on template by A.
Herráez as modified by J. Gutow
Using directory /Users/student/Documents/Wes and Jessica/webpage/m-xylene
  adding JmolPopIn.js
  ...jmolApplet0
      ...adding 6-21G_bond_length.png
copying and unzipping jsmol.zip directory into /Users/student/Documents/Wes and Jessica/webpage/m-xylene
      ...copying
file:/Users/student/Documents/Wes and Jessica/m-xylene/M-xylene_621G.log
         to
      ...compressing large data file to
/Users/student/Documents/Wes and Jessica/webpage/m-xylene/M-xylene_621G.log.gz
/Users/student/Documents/Wes and Jessica/webpage/m-xylene/M-xylene_621G.log.gz
      ...adding 6-21G_bond_length.spt
  ...jmolApplet1
      ...adding 6-21G_bond_angles.png
copying and unzipping jsmol.zip directory into /Users/student/Documents/Wes and Jessica/webpage/m-xylene
      ...adding 6-21G_bond_angles.spt
  ...jmolApplet2
      ...adding 6-31G_bond_length.png
copying and unzipping jsmol.zip directory into /Users/student/Documents/Wes and Jessica/webpage/m-xylene
      ...copying
file:/Users/student/Documents/Wes and Jessica/m-xylene/m-xylene_631G.log
         to
      ...compressing large data file to
/Users/student/Documents/Wes and Jessica/webpage/m-xylene/m-xylene_631G.log.gz
/Users/student/Documents/Wes and Jessica/webpage/m-xylene/m-xylene_631G.log.gz
      ...adding 6-31G_bond_length.spt
  ...jmolApplet3
      ...adding 6-31G_bond_angles.png
copying and unzipping jsmol.zip directory into /Users/student/Documents/Wes and Jessica/webpage/m-xylene
      ...adding 6-31G_bond_angles.spt
  ...jmolApplet4
      ...adding DZV_bond_length.png
copying and unzipping jsmol.zip directory into /Users/student/Documents/Wes and Jessica/webpage/m-xylene
      ...copying
file:/Users/student/Documents/Wes and Jessica/m-xylene/m-xylene_DZV.log
         to
      ...compressing large data file to
/Users/student/Documents/Wes and Jessica/webpage/m-xylene/m-xylene_DZV.log.gz
/Users/student/Documents/Wes and Jessica/webpage/m-xylene/m-xylene_DZV.log.gz
      ...adding DZV_bond_length.spt
  ...jmolApplet5
      ...adding DZV_bond_angles.png
copying and unzipping jsmol.zip directory into /Users/student/Documents/Wes and Jessica/webpage/m-xylene
      ...adding DZV_bond_angles.spt
  ...jmolApplet6
      ...adding HOMO.png
copying and unzipping jsmol.zip directory into /Users/student/Documents/Wes and Jessica/webpage/m-xylene
      ...adding HOMO.spt
  ...jmolApplet7
      ...adding LUMO.png
copying and unzipping jsmol.zip directory into /Users/student/Documents/Wes and Jessica/webpage/m-xylene
      ...adding LUMO.spt
  ...jmolApplet8
      ...adding Electrostatic_potential.png
copying and unzipping jsmol.zip directory into /Users/student/Documents/Wes and Jessica/webpage/m-xylene
      ...adding Electrostatic_potential.spt
  ...jmolApplet9
      ...adding Partial_atomic_charges.png
copying and unzipping jsmol.zip directory into /Users/student/Documents/Wes and Jessica/webpage/m-xylene
      ...adding Partial_atomic_charges.spt
  ...jmolApplet10
      ...adding 3213_19_CH_stretch.png
copying and unzipping jsmol.zip directory into /Users/student/Documents/Wes and Jessica/webpage/m-xylene
      ...copying
file:/Users/student/Documents/Wes and Jessica/m-xylene/m-xylene_DZV_vib.log
         to
      ...compressing large data file to
/Users/student/Documents/Wes and Jessica/webpage/m-xylene/m-xylene_DZV_vib.log.gz
/Users/student/Documents/Wes and Jessica/webpage/m-xylene/m-xylene_DZV_vib.log.gz
      ...adding 3213_19_CH_stretch.spt
  ...jmolApplet11
      ...adding 1795_12_ring_stretch.png
copying and unzipping jsmol.zip directory into /Users/student/Documents/Wes and Jessica/webpage/m-xylene
      ...adding 1795_12_ring_stretch.spt
  ...jmolApplet12
      ...adding 1475_99_ring_stretch.png
copying and unzipping jsmol.zip directory into /Users/student/Documents/Wes and Jessica/webpage/m-xylene
      ...adding 1475_99_ring_stretch.spt
  ...jmolApplet13
      ...adding 1197_96_CH_oscillations.png
copying and unzipping jsmol.zip directory into /Users/student/Documents/Wes and Jessica/webpage/m-xylene
      ...adding 1197_96_CH_oscillations.spt
  ...jmolApplet14
      ...adding 1017_18_CH_wag.png
copying and unzipping jsmol.zip directory into /Users/student/Documents/Wes and Jessica/webpage/m-xylene
      ...adding 1017_18_CH_wag.spt
  ...jmolApplet15
      ...adding 787_73_ring_stretch.png
copying and unzipping jsmol.zip directory into /Users/student/Documents/Wes and Jessica/webpage/m-xylene
      ...adding 787_73_ring_stretch.spt
  ...jmolApplet16
      ...adding 589_49_ring_stretch.png
copying and unzipping jsmol.zip directory into /Users/student/Documents/Wes and Jessica/webpage/m-xylene
      ...adding 589_49_ring_stretch.spt
This will be the viewer
If your
browser/OS combination is Java capable, you will get snappier
performance if you use Java