Once the molecule file is fully
loaded, the image at right will become live. At that time the
"activate 3-D" icon ![]() will disappear.
will disappear.
Oxygen (O2)
The geometry optimizations for the three highest level of theory
are shown. The bond angle of oxygen is 180 degrees and not
included for this report. The literature value for the bond
length of oxygen was 1.2075 angstroms.2 The
calculated values for each theory were the same and gave an
error of 6.00%.Table and Figure 1 below show the different orbitals for the O2 molecule starting with the S sigma bonding orbitals and going down to the highest energy orbitals. The two P orbitals represent the px and py orbitals that contribute to pi bonding.
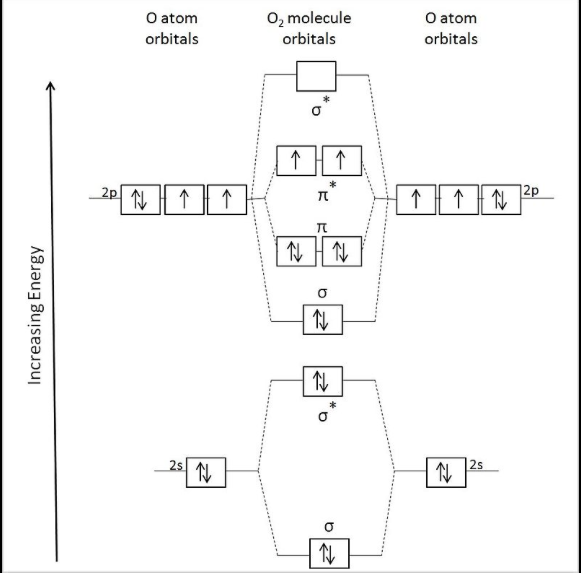
Figure 1: Orbital diagram showing the participating atomic orbitals from each oxygen atom, the molecular orbitals that result from their overlap, and the Aufbau filling of the orbitals.3
Table 1: Orbitals corresponding to the type of bonding occurring at that level.
| Type of Bonding |
Orbital |
| S sigma bonding |
 |
| S sigma anti-bonding |
 |
| P bonding |
 |
| P anti-bonding |
 |
| P2 bonding |  |
| P2 anti-bonding |  |
The different potential energies of bond stretching at different levels of theory are shown in Figure 1. The higher the level of theory, the lower in energy the theory calculates for the lowest potential energy. The bump in the graph is due to the interactions between electrons that are not accounted for in the theories. An experimental graph of potential energy would not have these bumps.
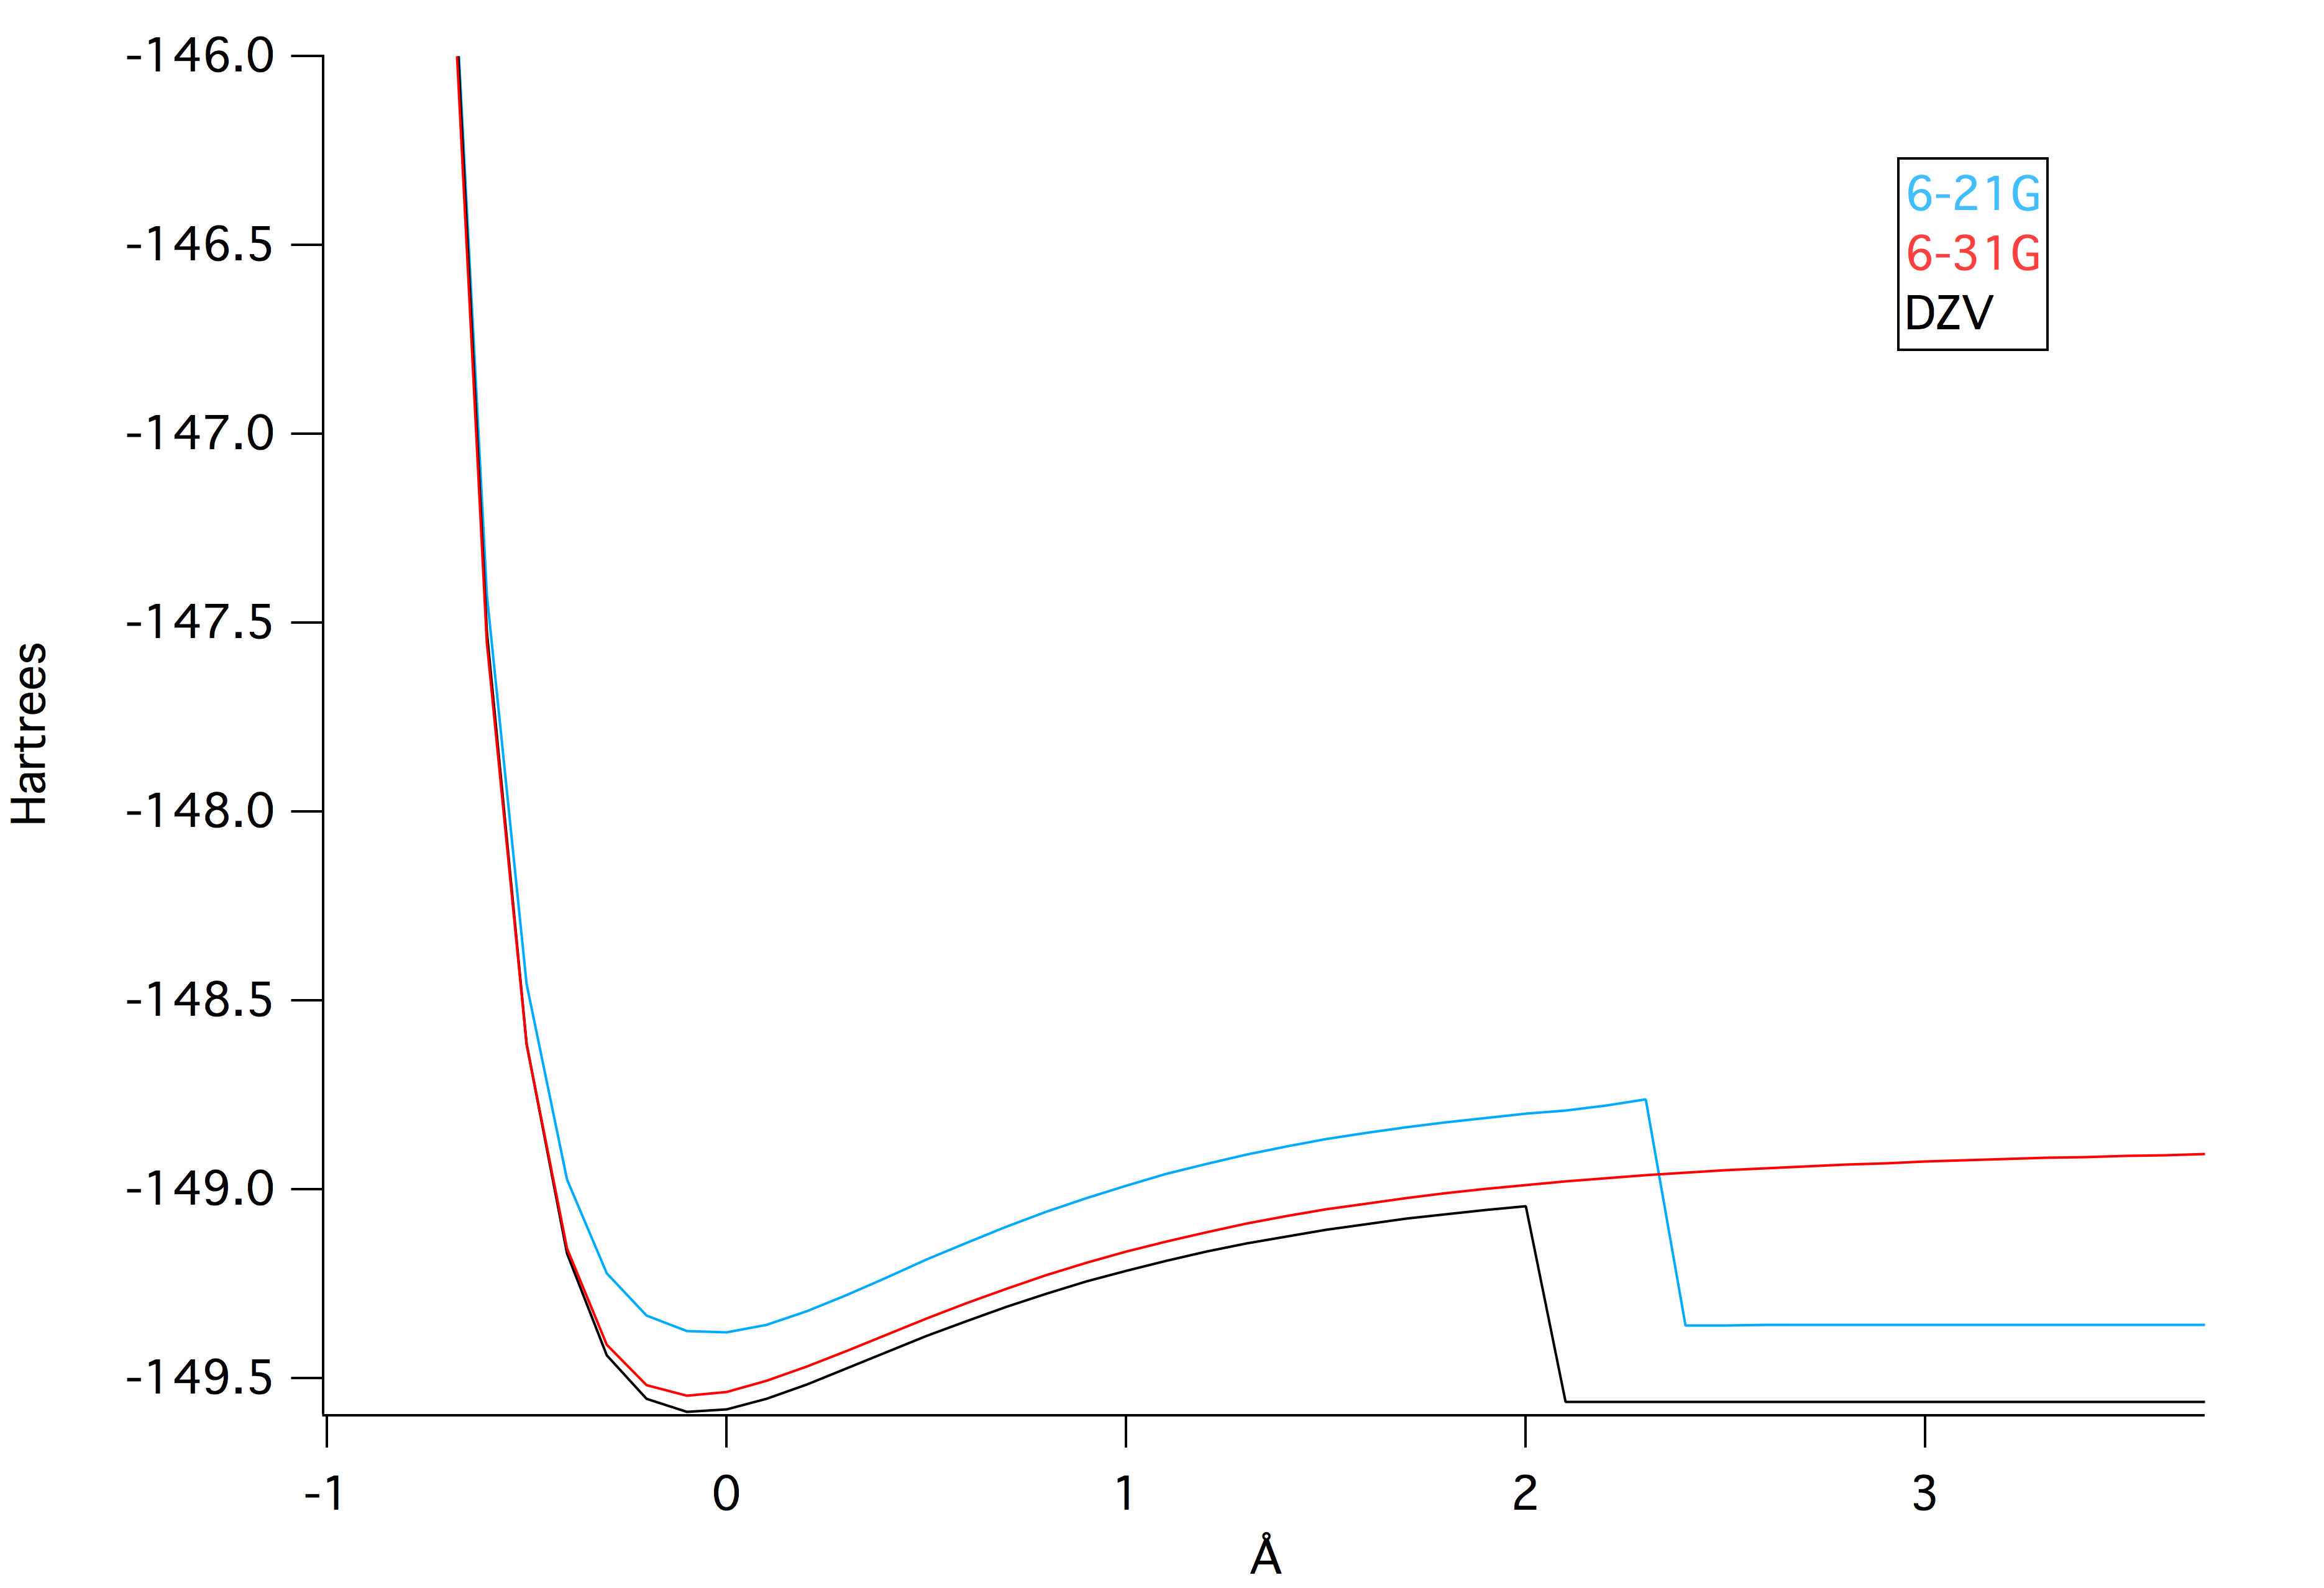
Figure 2: Potential energy (Hartrees) curves at different levels of theory plotted against bond lengths (angstroms).4
The vibrational frequency using DZV theory was 1364.52 cm-1. In comparison to the NIST database value, 1580 cm-1, there was a 13.6% error.2
You may look at any of these intermediate views again by clicking on the appropriate button.
Page skeleton
and JavaScript generated by export to web function using Jmol 14.2.15_2015.07.09
2015-07-09 22:22 on Feb 29, 2016.
This will be the viewer 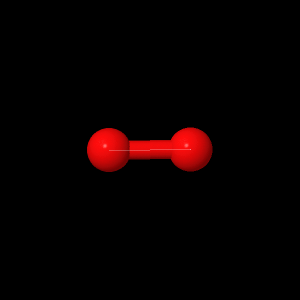
If your
browser/OS combination is Java capable, you will get snappier
performance if you use Java