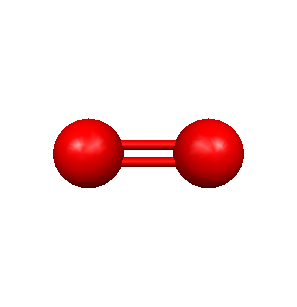
geometry due to the fact that it gave the highest
correlation between the literature values of the
bond lenghts and dipole moments and the experimental
values calculated.
Calculated Bond Length : 1.194824 A
Literature Value: 1.208 A
Calculated Dipole Moment: 0.0 Debye
Literature Value: 0.0 Debye
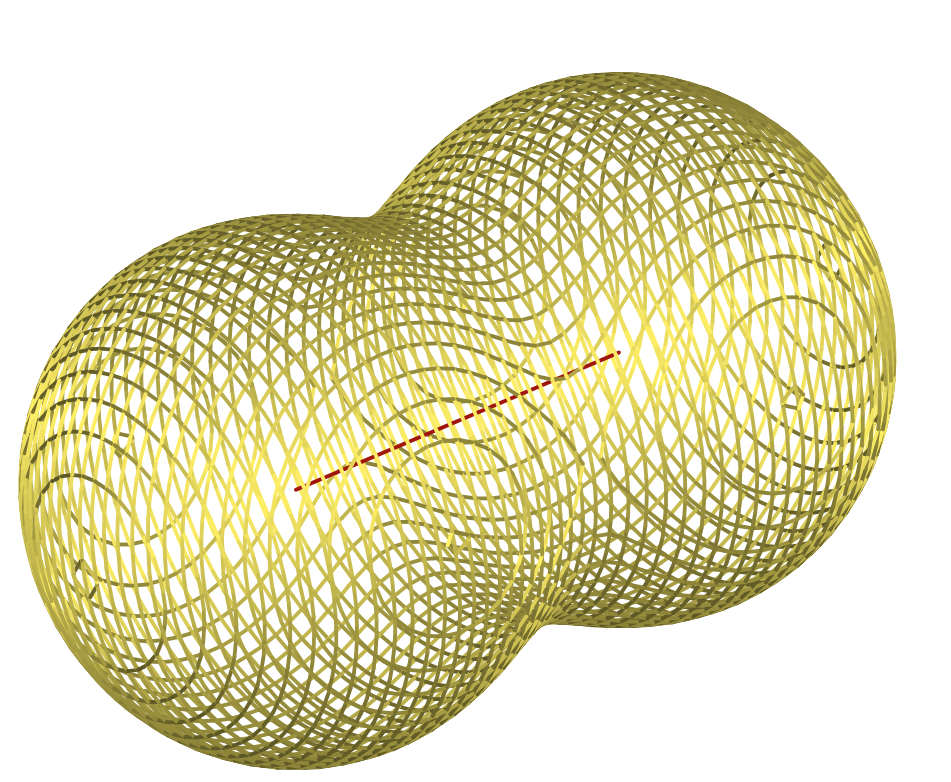
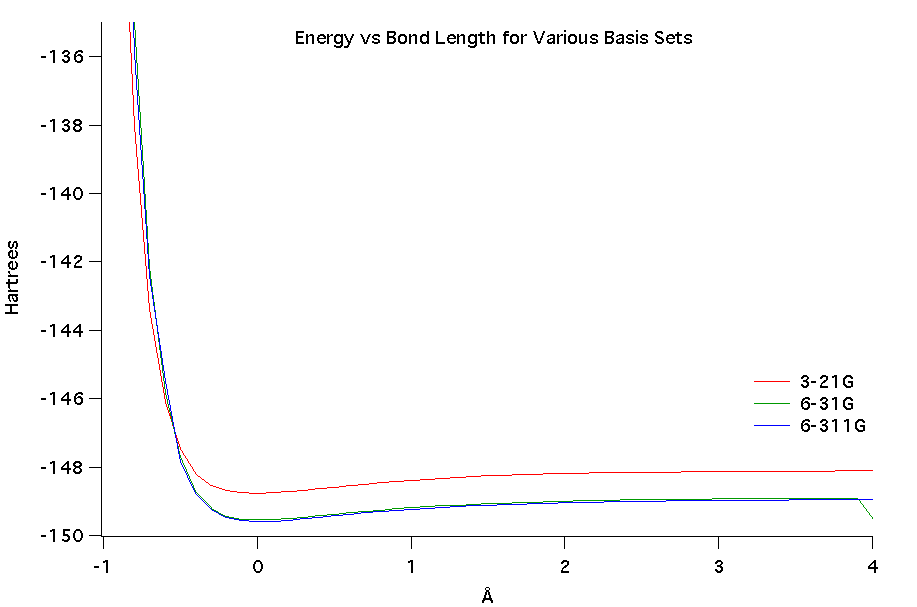
energy as a function of bond length.
It can be clearly seen from the graph that a larger
basis set leads to a lower potential energy curve.
In this graph the 6-311G basis set gives the lowest
potential energy curve.