Once the molecule file is fully
loaded, the image at right will become live. At that time the
"activate 3-D" icon ![]() will disappear.
will disappear.
C8H8
Styrene
Levels of Theory UsedStyrene
We used five different methods for calculating bond length. AM1 and PM3 were the simplest calculations. 6-21G, 6-31G , and Double Zeta Valence (DZV) used increasingly larger basis sets and were ab initio calculations making them computationally more difficult but theoretically more accurate.
AM1 was the simplest level of theory used.
PM3 was the second highest level of experimental geometry used to calculate bond length.
6-21G was the first ab initio calculation ran.
6-31G was another ab initio calculation with a larger basis set.
DZV was the most computationally intense level of theory used to calculate bond length. It was also slightly closer to the literature values than the other levels of theory.
| Bond Type |
Length (Angstroms) |
| C-C |
1.53 |
| C-H |
1.937 |
Bond angle is shown using DZV theory because all of the other models gave very similar results and DZV is the highest level of theory.
The literature showed a C-C bond length of 1.53 angstroms, C-H bond length of 1.084 angstroms and C-Br bond length of 1.937 angstroms4.
The highest occupied molecular orbital was orbital 28.
The lowest unoccupied molecular orbital was orbital 29.
The partial atomic charge of each atom in the molecule is due to differences in electronegativity of the atom.
The electrostatic potential represents the potential surface around the molecule. The red regions are low electrostatic potential while the blue regions are the highest electrostatic potential.
Table 7: Calculated dipole moments using different levels of theory.
| Theory |
Calculated Dipole Moment (Db) |
Percent Error (%) |
| 6-21G |
0.039350 |
18.4 |
| 6-31G |
0.125771 |
3.25 |
| DZV |
0.131452 |
0.145 |
The literature value was 0.13 debye4.
DZV, the highest level of theory, gave the dipole moment value that was closest to the literature value as expected.
Table 8: IR values obtained from literature with buttons for animations shown below
| Type of Bond |
Frequency (cm^-1) |
| C-H Stretch |
3000 |
| C-C Stretch |
1700 |
| Ring Stretch |
1600 |
| H-C-C Bend |
1200-1000 |
Figure 2. IR spectrum of Styrene3
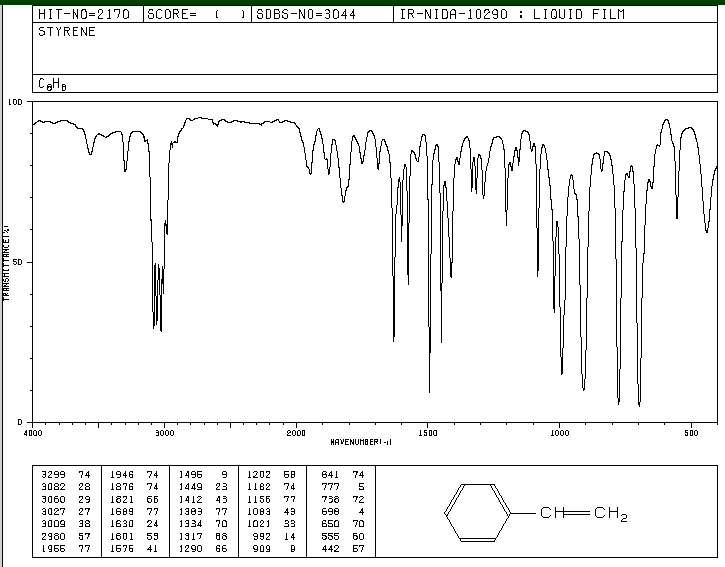
Table 8:
Calculated values for peaks on a UV-vis spectra. The
oscillator strength shows the probability of that peak being
on the graph. Values less than 0.1 were omitted from the
data.
| Oscillator Strength (unitless) |
Wavelength (nm) |
| 0.340946 |
208.93 |
| 0.807007 |
167.90 |
| 0.947094 |
156.24 |
| 0.101199 |
141.07 |
| 0.531012 |
137.93 |
Figure 3. Experimental UV-Vis spectrum3
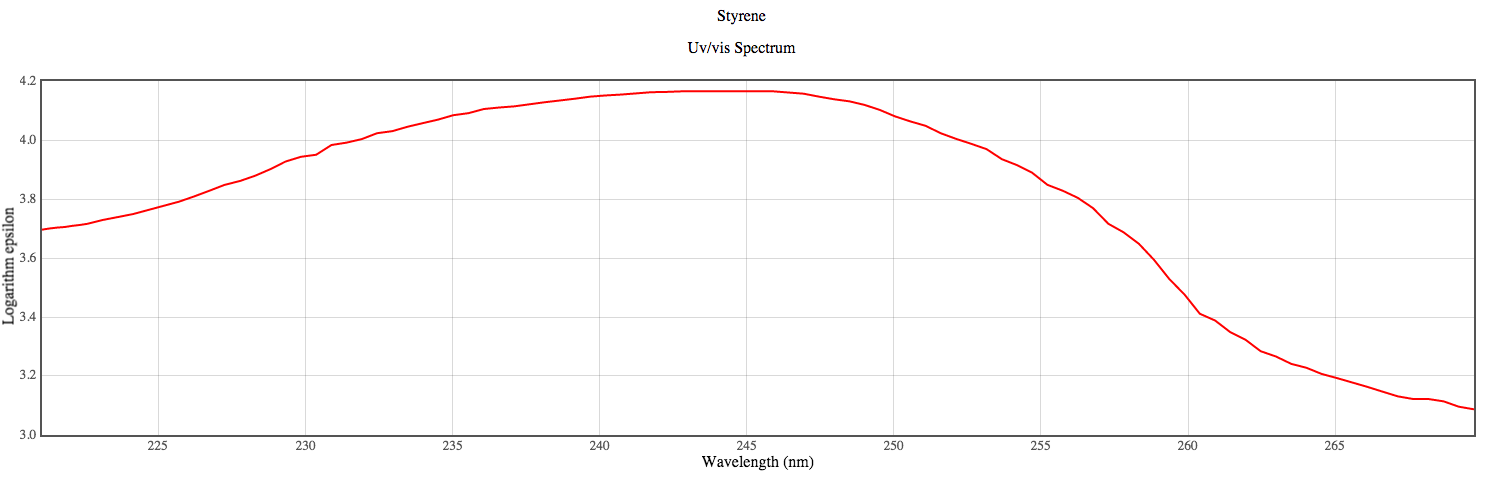
The predicted peaks using the DZV level of theory do not agree well the observed experimental value. It may be necessary to use a basis set even larger than DZV to find a more accurate calculated value.
In general the estimated peaks do not align well with experimental peaks. The most likely peak using the calculations is 156 nm while the highest absorbing peak experimentally is at approximately 240 nm.
You may look at any of these intermediate views again by clicking on the appropriate button.
Page skeleton
and JavaScript generated by export to web function using Jmol 14.2.12_2015.01.22
2015-01-22 21:48 on Mar 10, 2015.
This will be the viewer 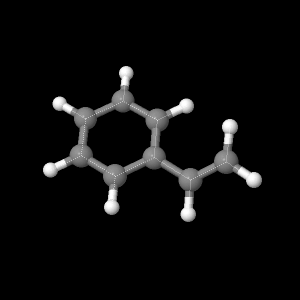
If your
browser/OS combination is Java capable, you will get snappier
performance if you use Java