Quantum Calculations on Cl2
The figures below were all drafted in Jmol from geometry optimizations made in Avogadro and calculated in GamessQ
|
|
Jmol0 will appear here.
|
|
|
CLICK IMAGE TO ACTIVATE 3D
(DZV) Cl2 HOMO here.
|
|
The figure to the right shows the Highest Occupied Molecular Orbital
diagram for the Cl2 molecule. From the diagram it is apparent that the
HOMO is an anti-bonding orbital due to the nodes between each pi
orbital. The orbital geometry was calculated using the DZV level
of theory.
|
|
|
Jmol1 will appear here.
|
|
|
CLICK IMAGE TO ACTIVATE 3D
(DZV) Cl2 LUMO
|
|
The figure to the left shows the Lowest Unoccupied Molecular Orbital for
Cl2. From the diagram it is apparent that this orbital is a bonding
orbital. The orbital geometry was calculated using the DZV level of theory.
|
|
|
Jmol2 will appear here.
|
|
|
CLICK IMAGE TO ACTIVATE 3D
(DZV) Cl2 Geometry
|
|
The figure to the right shows the (DZV) Cl2 Geometry bond length. When
this bond length is compared to the other levels of theory it is shown
that the DVZ level of theory is not closer to the experimental value for
Cl2- which is .19878nm.
|
|
|
Jmol3 will appear here.
|
|
|
CLICK IMAGE TO ACTIVATE 3D
(6-31G) Cl2 Geometry
|
|
The figure to the left shows the (6-31G) Cl2 Geometry bond length. This
level of theory is the closest value to the experimental results of
.19878nm even though it is not the most in-depth level of theory- DZV is
the most in-depth.
|
|
|
Jmol4 will appear here.
|
|
|
CLICK IMAGE TO ACTIVATE 3D
I (6-21G) Cl2 Geometry
|
|
The figure to the right shows
the (6-21G) Cl2 Geometry. While this level of theory does not give the
closest value to the experimental value, it is still a closer value
compared to the DZV value.
|
|
|
Jmol5 will appear here.
|
|
|
CLICK IMAGE TO ACTIVATE 3D
(Vib) Cl2 516.81 cm^-1
|
|
The figure to the left shows the vibration of Cl2 at 516.81 cm^-1. Since
this is a diatomic atom, there is only one vibrational degree of
freedom.
|
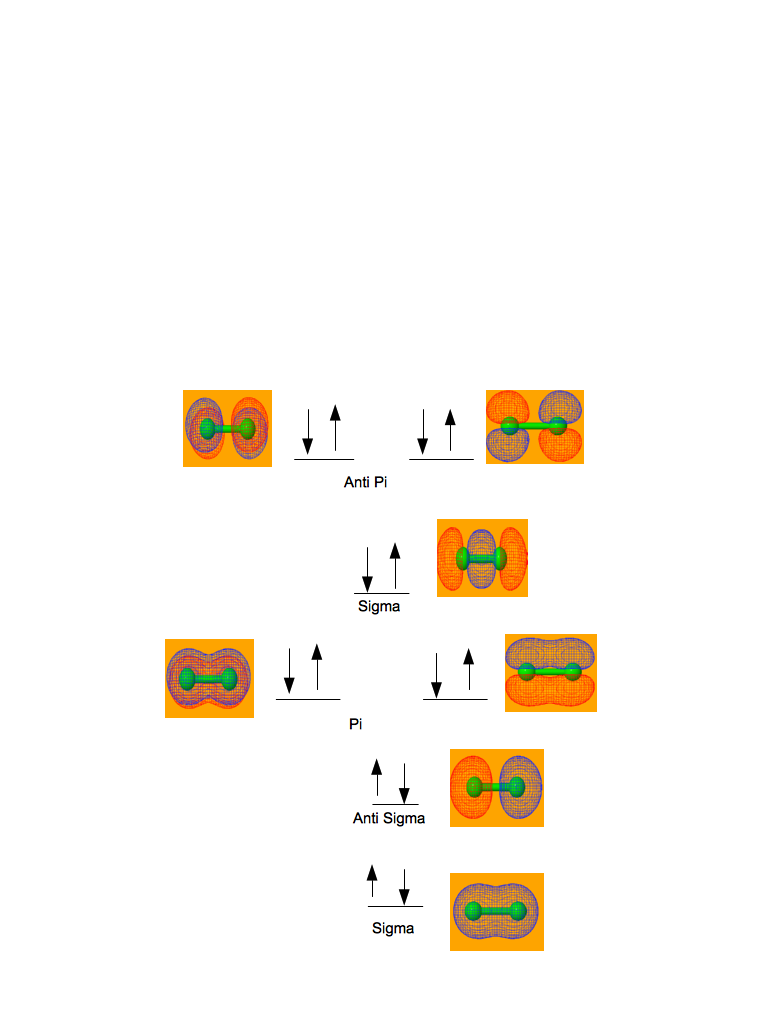
MO Diagram for the chlorine-chlorine molecular orbitals and calculated bonding orbital diagrams.
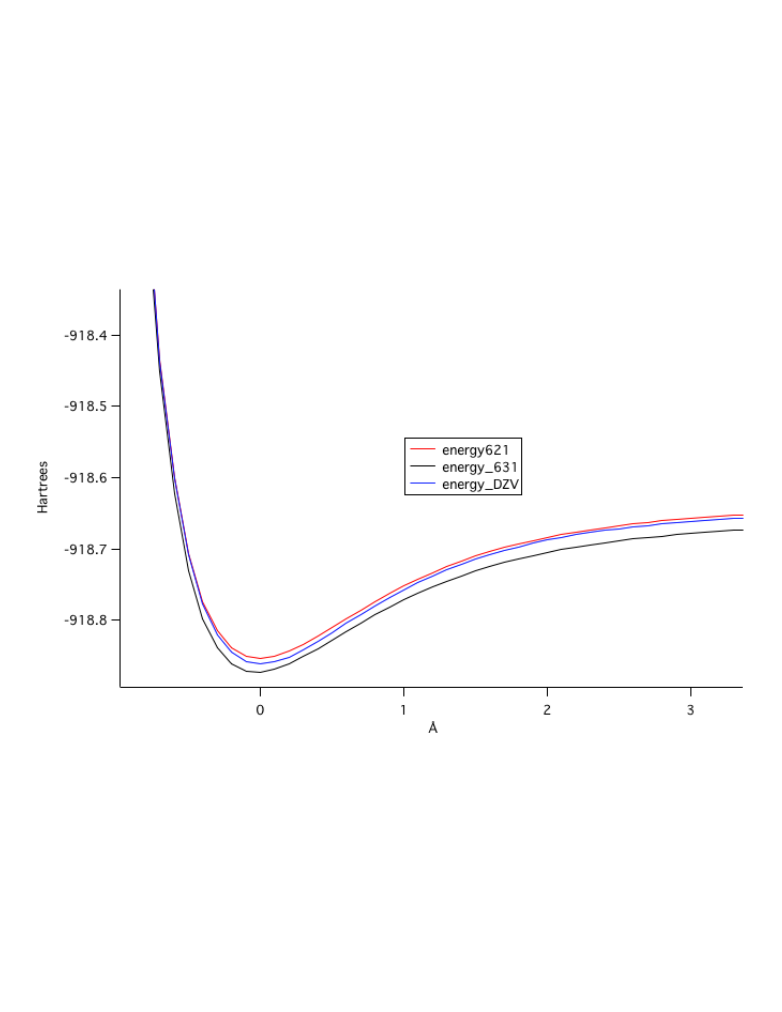
Plot of the potential energy of bond stretching, Red calculated with the
6-21G basis set, blue with the Double Zeta Valence, and black with the
6-31G basis set. From the plot it is apparent that the 6-31G plot is the
deepest and most accurate level of theory for the description of the
potential energy surface.
Based on template by A. Herráez as modified by J. Gutow
Using directory /Users/student/Documents/CKnMJ/Main_Directory(CKMJ)/Cl_2 (This One)/Cl_2
  adding JmolPopIn.js
  ...jmolApplet0
      ...adding _DZV__Cl2_HOMO.png
copying and unzipping jsmol.zip directory into /Users/student/Documents/CKnMJ/Main_Directory(CKMJ)/Cl_2 (This One)/Cl_2
      ...copying
file:/Users/student/Documents/CKnMJ/Cl_2/Cl_2(DZV).log
         to
      ...compressing large data file to
/Users/student/Documents/CKnMJ/Main_Directory(CKMJ)/Cl_2 (This One)/Cl_2/Cl_2(DZV).log.gz
/Users/student/Documents/CKnMJ/Main_Directory(CKMJ)/Cl_2 (This One)/Cl_2/Cl_2(DZV).log.gz
      ...adding _DZV__Cl2_HOMO.spt
  ...jmolApplet1
      ...adding _DZV__Cl2_LUMO.png
copying and unzipping jsmol.zip directory into /Users/student/Documents/CKnMJ/Main_Directory(CKMJ)/Cl_2 (This One)/Cl_2
      ...adding _DZV__Cl2_LUMO.spt
  ...jmolApplet2
      ...adding _DZV__Cl2_Geometry.png
copying and unzipping jsmol.zip directory into /Users/student/Documents/CKnMJ/Main_Directory(CKMJ)/Cl_2 (This One)/Cl_2
      ...adding _DZV__Cl2_Geometry.spt
  ...jmolApplet3
      ...adding _6-31G__Cl2_Geometry.png
copying and unzipping jsmol.zip directory into /Users/student/Documents/CKnMJ/Main_Directory(CKMJ)/Cl_2 (This One)/Cl_2
      ...copying
file:/Users/student/Documents/CKnMJ/Cl_2/Cl_2(6-31G).log
         to
/Users/student/Documents/CKnMJ/Main_Directory(CKMJ)/Cl_2 (This One)/Cl_2/Cl_2(6-31G).log
      ...adding _6-31G__Cl2_Geometry.spt
  ...jmolApplet4
      ...adding _6-21G__Cl2_Geometry.png
copying and unzipping jsmol.zip directory into /Users/student/Documents/CKnMJ/Main_Directory(CKMJ)/Cl_2 (This One)/Cl_2
      ...copying
file:/Users/student/Documents/CKnMJ/Cl_2/Cl_2(6-21G).log
         to
/Users/student/Documents/CKnMJ/Main_Directory(CKMJ)/Cl_2 (This One)/Cl_2/Cl_2(6-21G).log
      ...adding _6-21G__Cl2_Geometry.spt
  ...jmolApplet5
      ...adding _Vib__Cl2_516_81_cm_-1.png
copying and unzipping jsmol.zip directory into /Users/student/Documents/CKnMJ/Main_Directory(CKMJ)/Cl_2 (This One)/Cl_2
      ...copying
file:/Users/student/Documents/CKnMJ/Cl_2/Cl_2(Vib).log
         to
      ...compressing large data file to
/Users/student/Documents/CKnMJ/Main_Directory(CKMJ)/Cl_2 (This One)/Cl_2/Cl_2(Vib).log.gz
/Users/student/Documents/CKnMJ/Main_Directory(CKMJ)/Cl_2 (This One)/Cl_2/Cl_2(Vib).log.gz
      ...adding _Vib__Cl2_516_81_cm_-1.spt