Once the molecule file is fully loaded, the image at right will become live. At that time the "activate 3-D" icon ![]() will disappear.
will disappear.
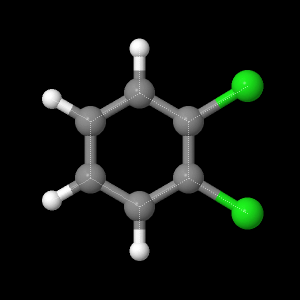
O-Dichlorobenzene
Geometry optimizations were done to find bond lengths and angles on o-dichlorobenzene (C6H4Cl2) using two semi-empirical methods. Following that, three ab initio
levels of theory were used to find the best geometry
optimizations. The experimentally measured lengths for C-Cl bonds were
0.1744 nm. The measured lengths for the C-H bonds were 0.1090 nm.5 Information about experimental bond angles were not found in the literature.AM1 was the first level of theory used. The AM1 calculated C-Cl bond length was the one that best matched the experimental value out of all of the calculated lengths. The calculated C-H bond lengths were slightly high compared to the measured value. The AM1 geometry optimization was used as a starting point for the three ab initio optimizations.
PM3 was the other semi-empirical method used. The bond lengths it gave were almost identical to the bond lengths calculated using AM1; the C-Cl bonds were just calculated to be 0.002 nm shorter, which made them more different from the experimental value.
All of the ab initio calculations gave the same bond lengths for the C-H bonds and the C-Cl bonds and differed from one another by a maximum of 0.003 nm for the C-C bonds.
6-21G was the lowest level of ab initio calculations used.
6-31G was the next level of ab initio calculations.
DZV was the last and highest level of theory used.
Using the geometry optimization from the best level of theory, DZV, the HOMO and LUMO were obtained. The HOMO was determined by taking the total number of electrons in the molecule and dividing by two due to two electrons into each orbital.
The LUMO was the orbital that had the next-highest energy after the HOMO.
The electrostatic potential of o-dichlorobenzene was generated using the geometry optimization calculations from the DZV level of theory. The red has a lower electrostatic potential while the blue has a higher electrostatic potential, implying that electrons are more likely to be present there. There is a negative cloud of electrons around the chlorine atoms and above and below the carbon atoms in the ring, while the hydrogen atoms are relatively electron deficient.
The experimental value for the dipole moment was determined to be 2.14 Debye. The two semi-empirical values were low, while the
three ab initio values were high. The best, or closest value, was found by the AM1 method, which was 1.97 Debye.
The DZV geometry optimization was used as the starting point to find the vibrations of the molecule. The frequencies of these vibrations were compared to the frequencies of the peaks on an experimentally-obtained IR spectrum (Figure 1).3
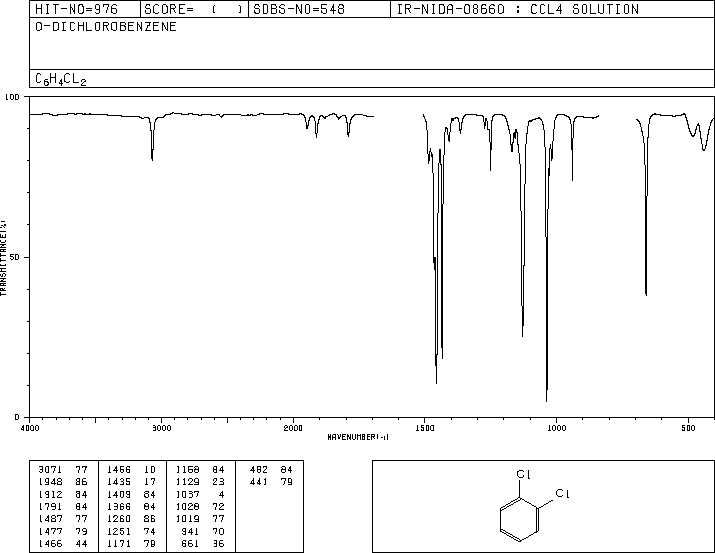
The DZV geometry optimization was used as the starting point to find the vibrations of the molecule. The frequencies of these vibrations were compared to the frequencies of the peaks on an experimentally-obtained IR spectrum (Figure 1).3
From the calculations, one vibration, a C-H stretch, can be seen at 3414.12 cm-1. The experimental peak that is closest to it is at a wavenumber of 3071.77 cm-1.
A vibration in the form of a C-C stretch comes at 1764.41 cm-1 in the calculations. This is close to the experimental peak at 1791.84 cm-1.
The calculations have another C-C stretch at 1589.24 cm-1. The experimental IR peak value that is the closest is 1487.77 cm-1.
A third calculated C-C stretch occurs at a wavenumber of 1409.19 cm-1, which very closely matches the experimental IR peak at 1409.54 cm-1.
The experimental IR peak at 1251.74 cm-1 corresponds to the calculated vibration, a C-Cl stretch, at a wavenumber of 1236.27 cm-1.
According to the calculations, there is a vibration that appears to be C-H bending at 1150.71 cm-1. This is close to the experimental IR peak located at 1160.84 cm-1.
A C-H rocking vibration at 1007.53 cm-1 is obtained from the calculations. The closest experimental IR peak is 941.7 cm-1.
The calculations also show a second C-H rocking at 878.0 cm-1. The closest experimental value is 947.7 cm-1.
Another C-Cl stretch is calculated to occur at 488.46 cm-1. There is an experimental IR peak at 482.84 cm-1, which is very likely what the calculated vibration corresponds to.
An experimental IR peak occurs at 441.79 cm-1; a calculated vibration that closely matches this value is a C-Cl rocking at 445.15 cm-1.
Calculations were done using the 6-21G, 6-31G, or DZV optimized geometry as a starting point in order to determine the transition energies between the ground state and each of the first through tenth excited states. These transition energies correspond to wavelengths on the electromagnetic spectrum that appear in the ultraviolet (UV) region. Most of the transitions were calculated to have oscillator strengths of less than 0.001 and would not be detected experimentally; however, there were two that had a high oscillator strength and would be noticeably present on the absorbance spectrum of o-dichlorobenzene. These are the transitions from ground state to the sixth and seventh excited states.
The values in units of wavenumbers that were the outputs of the calculations were converted into wavelengths using the equation:
wavelength (nm)=1/frequency (cm-1)x107 nm cm-1 (1)
The exact oscillator strengths and wavelengths of the absorbances calculated at each of the ab initio levels of theory are shown in Table 1.
Table 1. UV-Vis calculations results
| Level of Theory |
Oscillator Strength |
Wavelength (nm) |
| 6-21G |
1.4031 |
144.11 |
| 1.4593 |
142.20 |
|
| 6-31G |
1.4360 |
146.78 |
| 1.1641 |
144.99 |
|
| DZV |
1.4489 |
150.18 |
| 1.2014 |
148.92 |
You may look at any of these intermediate views again by clicking on the appropriate button.
Page skeleton and JavaScript generated by export to web function using Jmol 14.2.15_2015.07.09 2015-07-09 22:22 on Mar 1, 2016.
This will be the viewer
If your browser/OS combination is Java capable, you will get snappier performance if you use Java