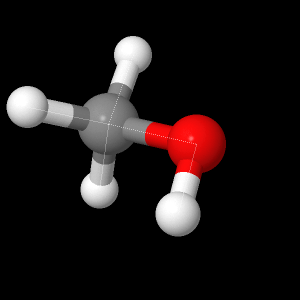
Once the molecule file is fully loaded, the image at right will become live. At that time the "activate 3-D" icon
![]()
will disappear.
Geometry optimizations for methanol were done using different levels of
theory and compared to the experimentally found geometry. The experimental values are
0.0956±0.0015 nm for the O-H bond, 0.1427±0.0007 nm for the C-O bond,
and 0.1096±0.0010 nm for the C-H bonds.
1 The
experimental values for the bond angles are 109.03°±0.75° for the angle
formed by H-C-H and 108.87°±2° for the angle formed by H-O-C.
1
Overall, none of the calculations at different levels of theory exactly
matched all of the bond lengths; however, different levels of theory
were closest for different bonds.
One of the semi-empirical methods used for the calculations was
AM1. It gave the closest calculated value for the O-H bond, at
0.096 nm. Its calculated bond angles were within the experimental
range for the C-O-H bond angle and some of the H-C-H bond angles.
The other semi-empirical method used for the calculations was PM3.
Its calculated bond lengths were less like the experimental value than
the bond lengths from AM1. The values obtained for the bond angles
from this calculation matched well with the experimental ranges.
6-21G was the lowest level of
ab initio theory that was used for
the calculations. The bond lengths that were calculated were
closest to the experimental value for the C-H bonds of the calculated
lengths at all levels of theory. Of the different
ab initio
levels of theory, it had the bond angle for C-O-H that best matched the
experimental range. The calculated H-C-H bond angles were also
within the experimentally determined range.
The next level of
ab initio theory was 6-31G. It gave a C-O
bond length that matched the experimental value best out of any that
were calculated. While the calculated bond angle for H-C-H matched
the experimentally-determined value, the value for the calculated angle
of the C-O-H bonds was high compared with the experimentally-derived
value.
DZV was the last level of
ab initio theory that was used.
While many of its calculated bond lengths were close to the experimental
values, none were the closest, despite DZV being the biggest basis
set. Like 6-31G, while the calculated bond angle for H-C-H matched
the
experimentally-determined value, the value for the calculated angle of
the C-O-H bonds was high compared with the experimentally-derived value.
The highest occupied molecular orbital (HOMO) for methanol was
determined by taking the total number of electrons in the molecule, 18,
and dividing by 2 because two electrons can occupy each orbital.
Therefore, the HOMO is orbital number 9. The orbital was displayed using the geometry optimization
from the DZV level of theory.
The lowest unoccupied molecular orbital (LUMO) of methanol was the
orbital just above the HOMO, meaning that it was orbital number
10.
An electrostatic potential map was generated using values calculated by
the DZV level of theory. The blue areas have the highest
electrostatic potential, indicating that electrons are less likely to be
in that area. The red areas have the lowest electrostatic
potential and, therefore, are more likely to have electrons
present. Based on the calculations, the oxygen atom has more
electrons around it, and the hydrogen atoms have less electrons around
them at any given time.
The partial atomic charges on each atom were calculated. The
oxygen atom has a negative charge, again showing that the electrons have
more of a tendency to be around it, while the charges on the hydrogen
atoms are positive, which means that the electrons are not around them
as much.
The dipole moment of methanol was calculated using all levels of
theory. The AM1 level, with a calculated dipole moment of 1.621044 Debye
most closely matched the experimental value of 1.700 Debye.
1
(5% error) It is interesting that AM1 calculated the value that
was the closest because AM1 is one of the semi-empirical levels and was
not expected to be superior for any of the calculations.
The vibrations of methanol were calculated using the DZV geometry
optimization as the starting point. Many of these vibrations and
their frequencies can be matched to the peaks on an IR spectrum of
methanol, although some of the calculated vibrations are IR inactive and would not
show up on the IR spectrum because they do not change the dipole moment
of the molecule.
2 The frequencies of the
calculated vibrations do not perfectly match the experimentally
determined frequencies. The IR spectrum is pictured in Figure 1,
and the modes and frequencies of vibration are pictured through
the links below.
Figure 1. IR spectrum of methanol. The spectrum also lists the
frequencies of the major peaks. These peaks can be matched up with
some of the vibrational modes that were calculated.
3
One vibration, an O-H stretch, was calculated to be 4082.47 cm
-1. On the experimentally-obtained IR spectrum it appears at 3347.6 cm
-1, which is a pretty significant difference.
One C-H stretch was calculated to occur at 3286 cm
-1, which best matches up with the peak on the IR spectrum at 3336.8 cm
-1.
The calculations showed a vibration, which was also a C-H stretch, at 3318.47 cm
-1. This is the calculated value that most closely matches the IR peak at 2945.16 cm
-1.
According to the calculations, what appears to be O-H rocking occurs at 1445.05 cm
-1, which pretty closely matches the experimental value on the IR spectrum of 1460.47 cm
-1.
Another calculated O-H rocking at 1138.64 cm
-1. The experimental vibrational value is 1116.62 cm
-1.
A C-O stretch was calculated to occur at 1112.64 cm
-1, and there is an experimental vibration at 1030 cm
-1.
The lowest-energy calculated vibration was torsion, or the groups at the
two ends of the molecule twisting relative to one another, and was at
323.74 cm
-1. This vibration was closest to the peak on the IR spectrum at 662 cm
-1.
You may look at any of these intermediate views again by clicking on the appropriate button.
Based on template by A. Herráez as modified by J. Gutow
Using directory /Users/student/Documents/KSSG/methanol script
  adding JmolPopIn.js
  ...jmolApplet0
      ...adding AM1_bond_lengths.png
copying and unzipping jsmol.zip directory into /Users/student/Documents/KSSG/methanol script
      ...copying
file:/Users/student/Documents/Kathy and Sean/CH3OH_AM1.log
         to
/Users/student/Documents/KSSG/methanol script/CH3OH_AM1.log
      ...adding AM1_bond_lengths.spt
  ...jmolApplet1
      ...adding AM1_bond_angles.png
copying and unzipping jsmol.zip directory into /Users/student/Documents/KSSG/methanol script
      ...adding AM1_bond_angles.spt
  ...jmolApplet2
      ...adding PM3_bond_lengths.png
copying and unzipping jsmol.zip directory into /Users/student/Documents/KSSG/methanol script
      ...copying
file:/Users/student/Documents/Kathy and Sean/CH3OH_PM3.log
         to
/Users/student/Documents/KSSG/methanol script/CH3OH_PM3.log
      ...adding PM3_bond_lengths.spt
  ...jmolApplet3
      ...adding PM3_bond_angles.png
copying and unzipping jsmol.zip directory into /Users/student/Documents/KSSG/methanol script
      ...adding PM3_bond_angles.spt
  ...jmolApplet4
      ...adding 6-21G_bond_lengths.png
copying and unzipping jsmol.zip directory into /Users/student/Documents/KSSG/methanol script
      ...copying
file:/Users/student/Documents/Kathy and Sean/CH3OH_6-21G.log
         to
/Users/student/Documents/KSSG/methanol script/CH3OH_6-21G.log
      ...adding 6-21G_bond_lengths.spt
  ...jmolApplet5
      ...adding 6-21G_bond_angles.png
copying and unzipping jsmol.zip directory into /Users/student/Documents/KSSG/methanol script
      ...adding 6-21G_bond_angles.spt
  ...jmolApplet6
      ...adding 6-31G_bond_lengths.png
copying and unzipping jsmol.zip directory into /Users/student/Documents/KSSG/methanol script
      ...copying
file:/Users/student/Documents/Kathy and Sean/CH3OH_6-31G.log
         to
      ...compressing large data file to
/Users/student/Documents/KSSG/methanol script/CH3OH_6-31G.log.gz
/Users/student/Documents/KSSG/methanol script/CH3OH_6-31G.log.gz
      ...adding 6-31G_bond_lengths.spt
  ...jmolApplet7
      ...adding 6-31G_bond_angles.png
copying and unzipping jsmol.zip directory into /Users/student/Documents/KSSG/methanol script
      ...adding 6-31G_bond_angles.spt
  ...jmolApplet8
      ...adding DZV_bond_lengths.png
copying and unzipping jsmol.zip directory into /Users/student/Documents/KSSG/methanol script
      ...copying
file:/Users/student/Documents/Kathy and Sean/CH3OH_DZV.log
         to
/Users/student/Documents/KSSG/methanol script/CH3OH_DZV.log
      ...adding DZV_bond_lengths.spt
  ...jmolApplet9
      ...adding DZV_bond_angles.png
copying and unzipping jsmol.zip directory into /Users/student/Documents/KSSG/methanol script
      ...adding DZV_bond_angles.spt
  ...jmolApplet10
      ...adding DZV_HOMO.png
copying and unzipping jsmol.zip directory into /Users/student/Documents/KSSG/methanol script
      ...adding DZV_HOMO.spt
  ...jmolApplet11
      ...adding DZV_LUMO.png
copying and unzipping jsmol.zip directory into /Users/student/Documents/KSSG/methanol script
      ...adding DZV_LUMO.spt
  ...jmolApplet12
      ...adding Electrostatic_Potential.png
copying and unzipping jsmol.zip directory into /Users/student/Documents/KSSG/methanol script
      ...adding Electrostatic_Potential.spt
  ...jmolApplet13
      ...adding Partial_Atomic_Charges.png
copying and unzipping jsmol.zip directory into /Users/student/Documents/KSSG/methanol script
      ...adding Partial_Atomic_Charges.spt
  ...jmolApplet14
      ...adding O-H_stretch.png
copying and unzipping jsmol.zip directory into /Users/student/Documents/KSSG/methanol script
      ...copying
file:/Users/student/Documents/Kathy and Sean/vibrations/CH3OH_DZV_vib.log
         to
      ...compressing large data file to
/Users/student/Documents/KSSG/methanol script/CH3OH_DZV_vib.log.gz
/Users/student/Documents/KSSG/methanol script/CH3OH_DZV_vib.log.gz
      ...adding O-H_stretch.spt
  ...jmolApplet15
      ...adding C-H_stretch.png
copying and unzipping jsmol.zip directory into /Users/student/Documents/KSSG/methanol script
      ...adding C-H_stretch.spt
  ...jmolApplet16
      ...adding C-H_stretch_2.png
copying and unzipping jsmol.zip directory into /Users/student/Documents/KSSG/methanol script
      ...adding C-H_stretch_2.spt
  ...jmolApplet17
      ...adding O-H_rocking.png
copying and unzipping jsmol.zip directory into /Users/student/Documents/KSSG/methanol script
      ...adding O-H_rocking.spt
  ...jmolApplet18
      ...adding O-H_rocking_2.png
copying and unzipping jsmol.zip directory into /Users/student/Documents/KSSG/methanol script
      ...adding O-H_rocking_2.spt
  ...jmolApplet19
      ...adding C-O_stretch.png
copying and unzipping jsmol.zip directory into /Users/student/Documents/KSSG/methanol script
      ...adding C-O_stretch.spt
  ...jmolApplet20
      ...adding torsion.png
copying and unzipping jsmol.zip directory into /Users/student/Documents/KSSG/methanol script
      ...adding torsion.spt