Once the molecule file is fully loaded, the image at right will become live. At that time the "activate 3-D" icon
![]()
will disappear.
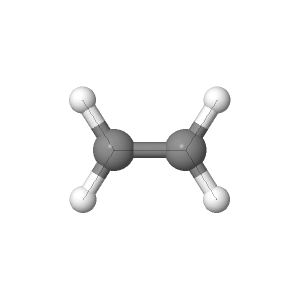
The three theories of geometry optimization are
shown below. Each theory is shown with the bond angles and lengths for
ethylene.
6-21G was the lowest theory of optimization meaning it used the least amount of basis sets.
6-31G was the second best theory of optimization that was used. With the
larger basis set the bond angles and lengths are closer to the
theoretical value than in the 6-21G.
DZV was the highest theory of optimization that was used. The bonding
angles and lengths that was calculated should be the closest of the
theories to the theoretical values.
The LUMO orbital was found by taking the HOMO and adding one electron.
This orbital happens when the atom is excited with enough energy that
the electron can move into the next orbital.
The electrostatic potential shows where the most electron density is in
the molecule. The blue area shows where the electrons are most likely to
be, and the red shows where they are least likely. The intermediate
colors represent the intermediate potentials.
When molecules have a asymmetric distribution of electrons the molecule
has a partial atomic charge. The positive value shows that the molecule
has more electrons near it's nucleus.
Using the highest level of theory the vibrational
frequencies could be calculated. Using an IR Spectrum for ethylene the
major peaks could be found. Using the vibrational calculations the peaks
could then be matched to the correct vibrations.
 Figure 1:
 Theoretical IR spectrum for Ethylene found on NIST.
Table 3: The expected vibration frequencies from the IR Spectrum
in Figure 1. The values in the table might not be exact compared to the
vibrational frequencies that the DZV calculations provided.
Type of Bond
|
Frequency (cm-1)
|
CH2 Rock
|
826
|
CH2 Wag
|
949
|
CH2 Twist
|
1023
|
CH2 Scissor
|
1342
|
C-C stretch
|
1494
|
C-H stretch asymmetrical
|
3103
|
C-H stretch symmetrical
|
2989
|
The graphics show the vibrational frequencies and how
the molecule moves at each of the frequencies calculated using the DZV
theory.
At 916 cm^-1
At 1110 cm^-1
At 1139 cm^-1
At 1356 cm^-1
At 1494 cm^-1
At 3337 cm^-1
At 3364 cm^-1
The vibrational frequencies that was calculated using
the DZV theory were quite off from the theoretical in some cases. This
could have happened because the theory uses mathematics to calculate the
vibrational frequencies where as the IR uses light and a detector.
The theoretical dipole for ethylene is zero
since it is a non-polar hydrocarbon. The 6-21G and the 6-31G theories
gave a dipole of zero, but the DZV theory gave a dipole of 0.000003
Debyes which could have been cause by the large amount of basis sets in
the calculation.
You may look at any of these intermediate views again by clicking on the appropriate button.
Based on template by A. Herráez as modified by J. Gutow
Using directory /Users/student/Documents/Nate & Josh Molecular Orbital Lab/Webpage Files Josh & Nate/Josh & Nate Ethylene
  adding JmolPopIn.js
  ...jmolApplet0
      ...adding 621-G_bond_lengths.png
copying and unzipping jsmol.zip directory into /Users/student/Documents/Nate & Josh Molecular Orbital Lab/Webpage Files Josh & Nate/Josh & Nate Ethylene
      ...copying
file:/Users/student/Documents/Nate & Josh Molecular Orbital Lab/Ethylene/Ethylene_macmol_PM3_621G.log
         to
/Users/student/Documents/Nate & Josh Molecular Orbital Lab/Webpage Files Josh & Nate/Josh & Nate Ethylene/Ethylene_macmol_PM3_621G.log
      ...adding 621-G_bond_lengths.spt
  ...jmolApplet1
      ...adding 621-G_bond_angles.png
copying and unzipping jsmol.zip directory into /Users/student/Documents/Nate & Josh Molecular Orbital Lab/Webpage Files Josh & Nate/Josh & Nate Ethylene
      ...adding 621-G_bond_angles.spt
  ...jmolApplet2
      ...adding 631-G_bond_lengths.png
copying and unzipping jsmol.zip directory into /Users/student/Documents/Nate & Josh Molecular Orbital Lab/Webpage Files Josh & Nate/Josh & Nate Ethylene
      ...copying
file:/Users/student/Documents/Nate & Josh Molecular Orbital Lab/Ethylene/Ethylene_macmol_PM3_631G.log
         to
/Users/student/Documents/Nate & Josh Molecular Orbital Lab/Webpage Files Josh & Nate/Josh & Nate Ethylene/Ethylene_macmol_PM3_631G.log
      ...adding 631-G_bond_lengths.spt
  ...jmolApplet3
      ...adding 631-G_bond_angles.png
copying and unzipping jsmol.zip directory into /Users/student/Documents/Nate & Josh Molecular Orbital Lab/Webpage Files Josh & Nate/Josh & Nate Ethylene
      ...adding 631-G_bond_angles.spt
  ...jmolApplet4
      ...adding DZV_bond_lengths.png
copying and unzipping jsmol.zip directory into /Users/student/Documents/Nate & Josh Molecular Orbital Lab/Webpage Files Josh & Nate/Josh & Nate Ethylene
      ...copying
file:/Users/student/Documents/Nate & Josh Molecular Orbital Lab/Ethylene/Ethylene_macmol_PM3_DZV.log
         to
      ...compressing large data file to
/Users/student/Documents/Nate & Josh Molecular Orbital Lab/Webpage Files Josh & Nate/Josh & Nate Ethylene/Ethylene_macmol_PM3_DZV.log.gz
/Users/student/Documents/Nate & Josh Molecular Orbital Lab/Webpage Files Josh & Nate/Josh & Nate Ethylene/Ethylene_macmol_PM3_DZV.log.gz
      ...adding DZV_bond_lengths.spt
  ...jmolApplet5
      ...adding DZV_bond_angles.png
copying and unzipping jsmol.zip directory into /Users/student/Documents/Nate & Josh Molecular Orbital Lab/Webpage Files Josh & Nate/Josh & Nate Ethylene
      ...adding DZV_bond_angles.spt
  ...jmolApplet6
      ...adding DZV_HOMO.png
copying and unzipping jsmol.zip directory into /Users/student/Documents/Nate & Josh Molecular Orbital Lab/Webpage Files Josh & Nate/Josh & Nate Ethylene
      ...adding DZV_HOMO.spt
  ...jmolApplet7
      ...adding DZV_LUMO.png
copying and unzipping jsmol.zip directory into /Users/student/Documents/Nate & Josh Molecular Orbital Lab/Webpage Files Josh & Nate/Josh & Nate Ethylene
      ...adding DZV_LUMO.spt
  ...jmolApplet8
      ...adding electrostatic_potential.png
copying and unzipping jsmol.zip directory into /Users/student/Documents/Nate & Josh Molecular Orbital Lab/Webpage Files Josh & Nate/Josh & Nate Ethylene
      ...adding electrostatic_potential.spt
  ...jmolApplet9
      ...adding partial_atomic_charges.png
copying and unzipping jsmol.zip directory into /Users/student/Documents/Nate & Josh Molecular Orbital Lab/Webpage Files Josh & Nate/Josh & Nate Ethylene
      ...adding partial_atomic_charges.spt
  ...jmolApplet10
      ...adding CH2_rock.png
copying and unzipping jsmol.zip directory into /Users/student/Documents/Nate & Josh Molecular Orbital Lab/Webpage Files Josh & Nate/Josh & Nate Ethylene
      ...copying
file:/Users/student/Documents/Nate & Josh Molecular Orbital Lab/Ethylene/Ethylene_macmol_PM3_DZV_vibrational.log
         to
      ...compressing large data file to
/Users/student/Documents/Nate & Josh Molecular Orbital Lab/Webpage Files Josh & Nate/Josh & Nate Ethylene/Ethylene_macmol_PM3_DZV_vibrational.log.gz
/Users/student/Documents/Nate & Josh Molecular Orbital Lab/Webpage Files Josh & Nate/Josh & Nate Ethylene/Ethylene_macmol_PM3_DZV_vibrational.log.gz
      ...adding CH2_rock.spt
  ...jmolApplet11
      ...adding CH2_wag.png
copying and unzipping jsmol.zip directory into /Users/student/Documents/Nate & Josh Molecular Orbital Lab/Webpage Files Josh & Nate/Josh & Nate Ethylene
      ...adding CH2_wag.spt
  ...jmolApplet12
      ...adding CH2_twist.png
copying and unzipping jsmol.zip directory into /Users/student/Documents/Nate & Josh Molecular Orbital Lab/Webpage Files Josh & Nate/Josh & Nate Ethylene
      ...adding CH2_twist.spt
  ...jmolApplet13
      ...adding CH2_scissor.png
copying and unzipping jsmol.zip directory into /Users/student/Documents/Nate & Josh Molecular Orbital Lab/Webpage Files Josh & Nate/Josh & Nate Ethylene
      ...adding CH2_scissor.spt
  ...jmolApplet14
      ...adding C-C_stretch.png
copying and unzipping jsmol.zip directory into /Users/student/Documents/Nate & Josh Molecular Orbital Lab/Webpage Files Josh & Nate/Josh & Nate Ethylene
      ...adding C-C_stretch.spt
  ...jmolApplet15
      ...adding C-H_stretch_asymmetrical.png
copying and unzipping jsmol.zip directory into /Users/student/Documents/Nate & Josh Molecular Orbital Lab/Webpage Files Josh & Nate/Josh & Nate Ethylene
      ...adding C-H_stretch_asymmetrical.spt
  ...jmolApplet16
      ...adding C-H_stretch_symmetrical.png
copying and unzipping jsmol.zip directory into /Users/student/Documents/Nate & Josh Molecular Orbital Lab/Webpage Files Josh & Nate/Josh & Nate Ethylene
      ...adding C-H_stretch_symmetrical.spt