Once the molecule file is fully loaded, the image at right will become live. At that time the "activate 3-D" icon ![]() will disappear.
will disappear.
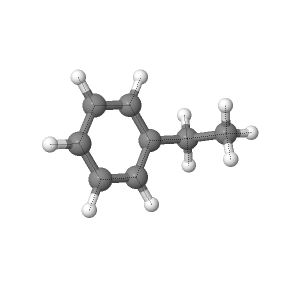
Ethylbenzene.
The 6-21G is the lowest level of theory that
was used out of the three theories. Each of the theories were used to
calculate bond lengths and angles. 6-31G was the second highest level of theory that was used. The bond lengths and angles that are found using this theory should be closer to the theoretical value than the 6-21G theory.
DZV theory is the largest level of theory that was used to optimize geometries. It uses the most basis sets when doing calculations. The values obtained from this basis set should give the closest values tot eh theoretical.
Figure 1: Ethylbenzene atom labels

Table 1: The bond angles for ethylbenzene found on NIST.
Table 2: Bond lengths
Table 1: The bond angles for ethylbenzene found on NIST.
| Bond Angle |
Theoretical Bond Angle |
Calculated Bond Angle |
| C178 |
113.08 |
112.7 |
| C123 |
121.01 |
121.0 |
| C345 |
119.39 |
119.4 |
| C456 |
120.20 |
120.2 |
Table 2: Bond lengths
| Bond Length |
Theoretical Bond Length (nm) |
Calculated Bond Length (nm) |
| C17 |
.1524 |
.152 |
| C78 |
.1535 |
.154 |
| CC Aromatic |
.1399 |
.14 |
| CH Approximation |
.1094 |
.107 |
The electrostatic potential shows where the electron density is on the molecule. The blue shows where the highest electrostatic potential is on the molecule and the red shows where the lowest potential is. The intermediate colors show an intermediate potential.
The partial atomic charges on each atom is shown below. The partial charges are created when atoms have an asymmetric distribution of electrons.
Vibrational frequencies were calculated using DZV which is the highest level of theory. A IR Spectrum was found on NIST and the major peaks were found and described. Then using the IR peaks the vibrational frequency movements could be found and shown to better explain what is actually happening to the molecule.

Figure 1: Theoretical IR spectrum for ethylbenzene found on NIST.
Using the IR the major vibrational frequencies could be found. Using the DZV vibrational calculations the movements could be shown for the major vibrations.
At 231 cm^-1
At 151 cm^-1
342 cm^-1
623 cm^-1
799 cm^-1
1047 cm^-1
1414 cm^-1
1500 cm^-1
1608 cm^-1
1799 cm^-1
3203 cm^-1
3380 cm^-1
Table 3: The calculated peaks for UV-vis spectra
Recorded highest oscillator strength.
Table 3: The calculated peaks for UV-vis spectra
Recorded highest oscillator strength.
| Oscillator Strength |
Wavelength (nm) |
| 0.02314 |
128.2 |
| 1.031 |
147.6 |
| 1.506 |
148.3 |
There was no UV-vis experimental
data available. So we compared our looked at experimental peaks for
Toluene which is a similar molecule.
Table 4: Values for Peaks of Toluene
Using the DZV theory, which is the largest theory since it uses the most basis sets in the calculations, the dipole moment could be found. The experimental value calculated by DZV theory gave a dipole of 0.416 Debye and the theoretical value was found on NIST to be 0.417 Debye, which gave an error of 2.4%
Table 4: Values for Peaks of Toluene
| Log Epsilon |
Wavelength (nm) |
| 2.36 |
253 |
| 2.42 |
259 |
| 2.43 |
261 |
| 2.47 |
268 |
Using the DZV theory, which is the largest theory since it uses the most basis sets in the calculations, the dipole moment could be found. The experimental value calculated by DZV theory gave a dipole of 0.416 Debye and the theoretical value was found on NIST to be 0.417 Debye, which gave an error of 2.4%
You may look at any of these intermediate views again by clicking on the appropriate button.
Page skeleton and JavaScript generated by export to web function using Jmol 14.2.12_2015.01.22 2015-01-22 21:48 on Mar 8, 2015.
This will be the viewer
If your browser/OS combination is Java capable, you will get snappier performance if you use Java