Once the molecule file is fully loaded, the image at right will become live. At that time the "activate 3-D" icon
![]()
will disappear.
Geometry Optimizations were produced in AM1 and
PM3 formats and sent though three levels of theory; 6-21G, 6-31G, and
DZV. FCL Bond Length Literature Value is 1.63 angstroms
6. The bond angle
is not included because it is a linear molecule.
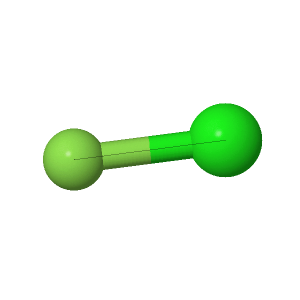
AM1 Geometry shows the shape of the molecule and it's bond
length of 1.65 angstroms compared to the theoretical bond length value
of 1.63 angstroms.
PM3 Geometry includes the shape and deviates to 1.71 angstroms.
Using the lowest level of theory for geometry optimization.
The next level of theory used for geometry optimizations.
The highest level of theory provided geometric optimizations.
Table 1: Calculated bond lengths compared to the literature value
6 with their respective percent errors.
Level of Theory
|
Calculated Bond Length
|
Literature Value
|
Percent Error
|
AM1
|
1.65
|
1.63
|
1%
|
PM3
|
1.71
|
1.63
|
5%
|
6-21G
|
1.65
|
1.63
|
1%
|
6-31G
|
1.65
|
1.63
|
1%
|
DZV
|
1.65
|
1.63
|
1%
|
HOMO is the Highest Occupied Molecular Orbital. This orbital was
found at frame 6. Calculations include adding the electrons in the
molecule and dividing by two.
LUMO is the Lowest Unoccupied Molecular Orbital. This orbital
was found at frame 6. In an excited state, this orbital would be the
first to be occupied.
On the Electrostatic Potential diagram, the red cloud is the lowest and the blue cloud is the highest electrostatic potential.
The Partial Atomic Charges are formed due to asymmetric distribution of electrons.
Table 2: The vibrational frequencies of the FCl molecule
6.
Type of Bond
|
Literature Frequency (cm-1)
|
Experimental Frequency (cm-1)
|
Percent Error
|
Bend
|
363
|
272
|
25%
|
Stretch
|
786
|
658
|
16%
|
Figure 1 is a graph that represents the different potential energies
that bonds are able to stretch in relation to to the levels of theory
that were tested. The graph shows that the higher level of theory
produced the lowest values for potential energy. Figure 2, shows a
comparison between the same three levels of theory in comparison to AM1,
which showed it had far greater potential energy.
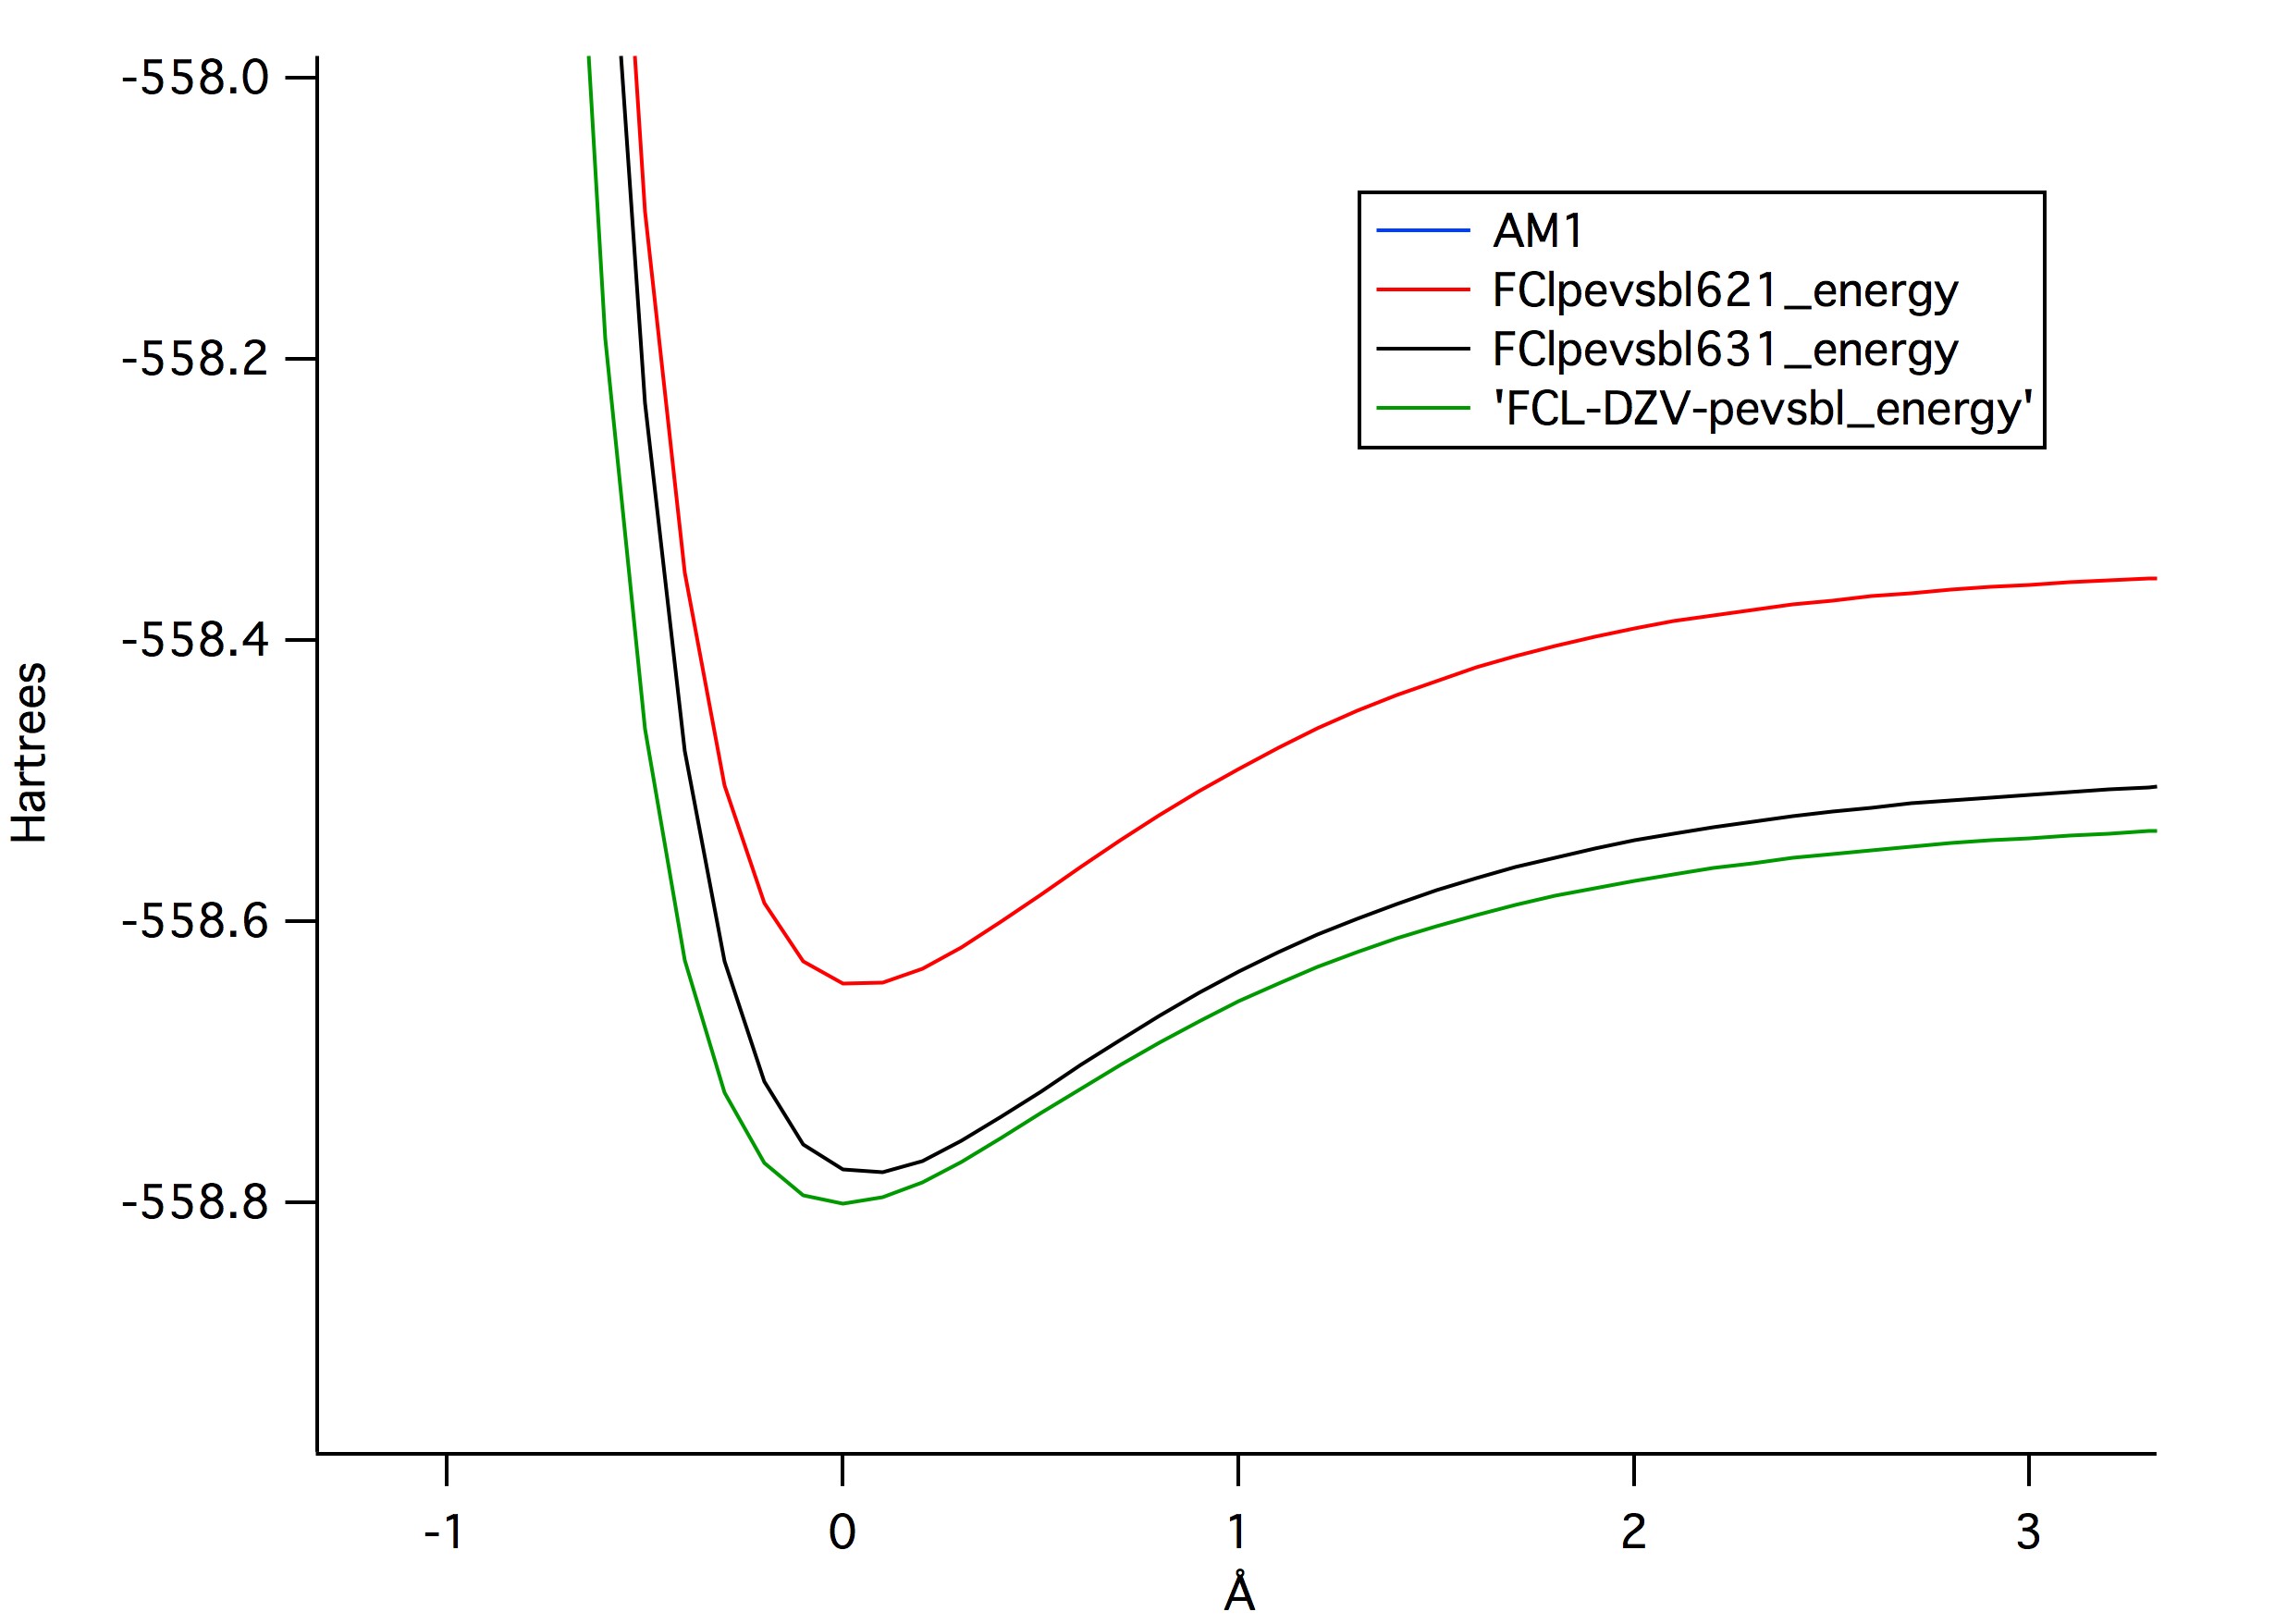 Figure 1
: The different levels of theory and their
potential energy curves. The higher level of theory shows the lowest
possible potential energy.
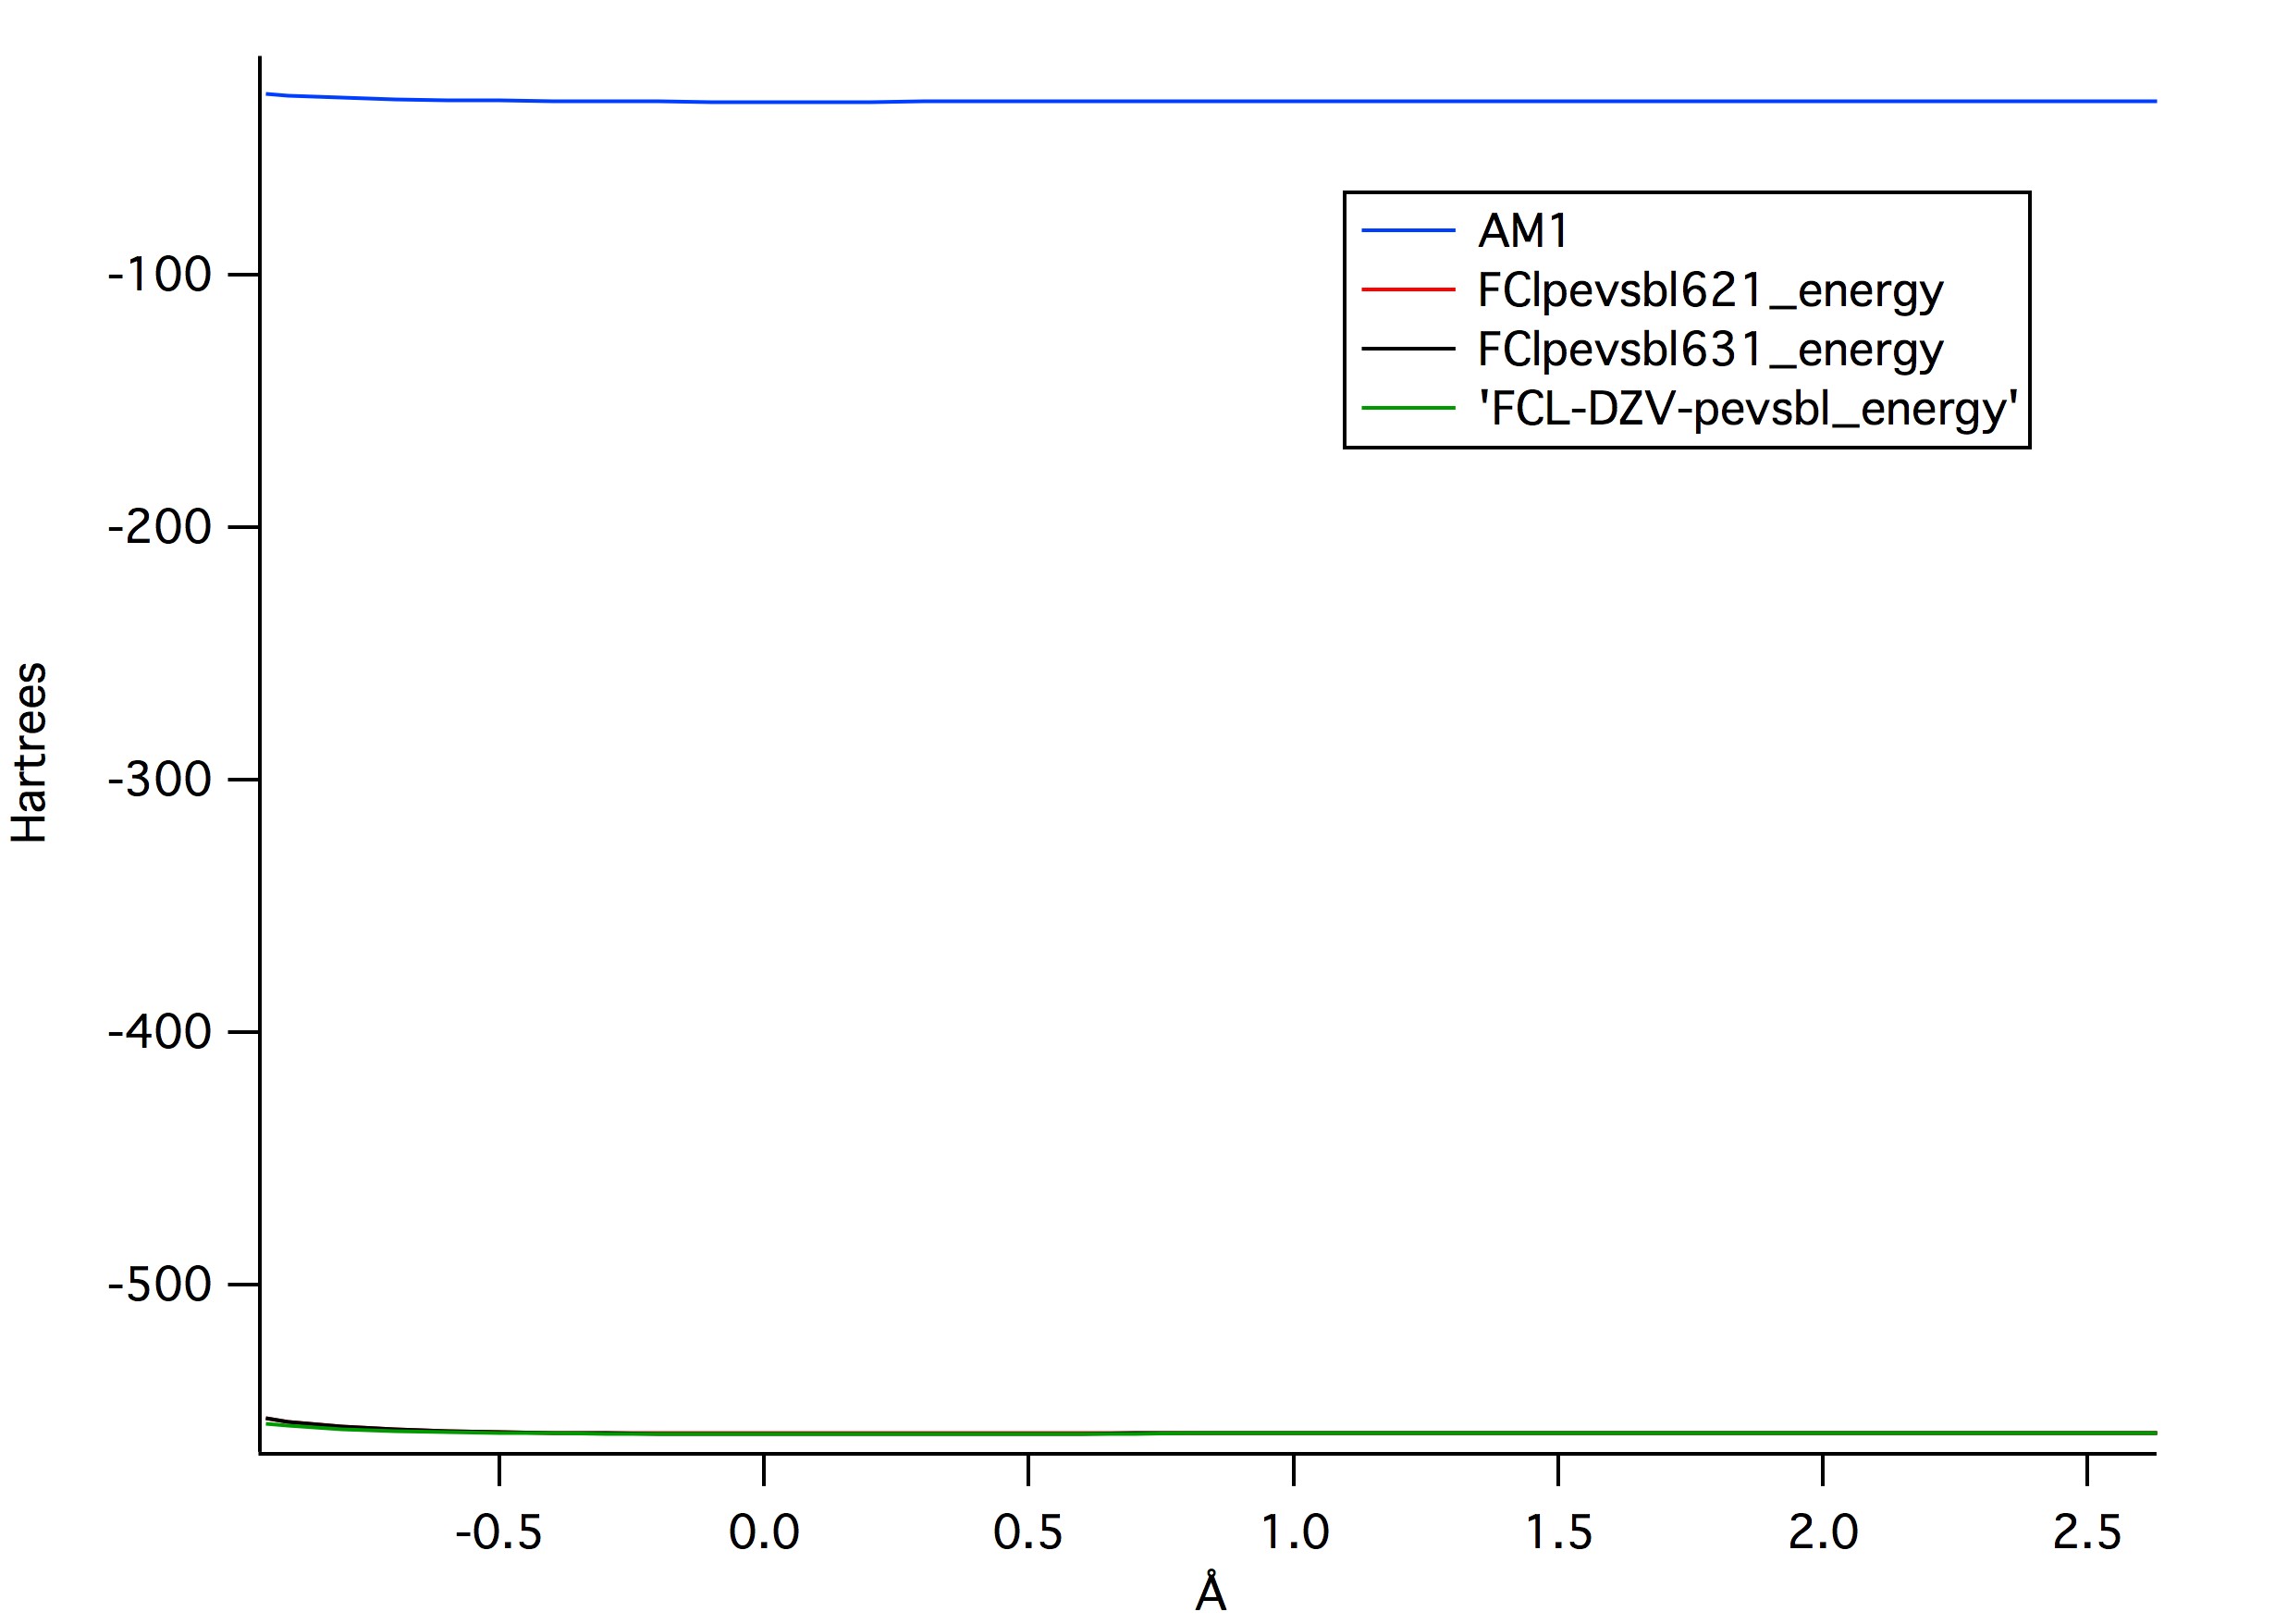 Figure 2:
 The comparison between the three levels of theories and AM1 configuration. AM1 has such larger potential energy.
The dipole moment for FCl when calculated was 0.907 D, whereas the
literature value was 0.888 D. This gave a percent error of 2.1%
The following figures are images of the corresponding molecular orbitals to the valence electron energy levels.
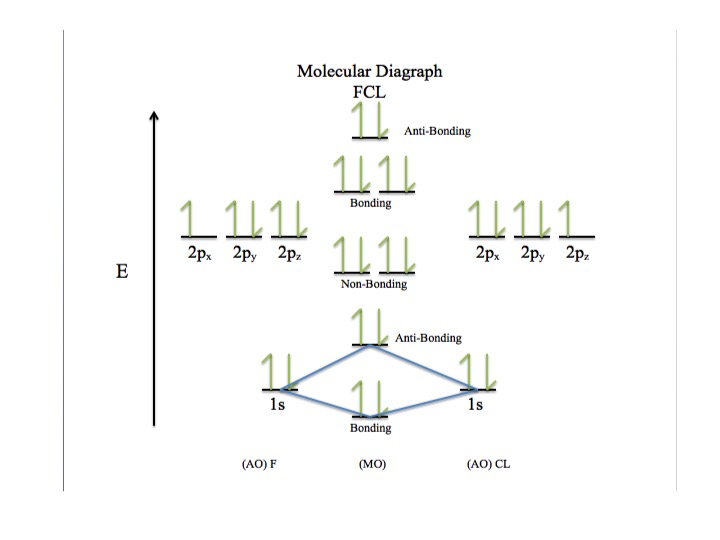 Figure 3:
 Molecular diagram of FCL
Based on template by A. Herráez as modified by J. Gutow
Using directory /Users/student/Documents/GRLG/FCl
  adding JmolPopIn.js
  ...jmolApplet0
      ...adding FCl_AM1_Geometry.png
copying and unzipping jsmol.zip directory into /Users/student/Documents/GRLG/FCl
      ...copying
file:/Users/student/Desktop/FCl/FClam1GO.log
         to
/Users/student/Documents/GRLG/FCl/FClam1GO.log
      ...adding FCl_AM1_Geometry.spt
  ...jmolApplet1
      ...adding FCl_PM3_Geometry.png
copying and unzipping jsmol.zip directory into /Users/student/Documents/GRLG/FCl
      ...copying
file:/Users/student/Desktop/FCl/FClpm3.log
         to
/Users/student/Documents/GRLG/FCl/FClpm3.log
      ...adding FCl_PM3_Geometry.spt
  ...jmolApplet2
      ...adding FCl_Bond_Length_6-21G.png
copying and unzipping jsmol.zip directory into /Users/student/Documents/GRLG/FCl
      ...copying
file:/Users/student/Desktop/FCl/FClpevsbl621.log
         to
      ...compressing large data file to
/Users/student/Documents/GRLG/FCl/FClpevsbl621.log.gz
/Users/student/Documents/GRLG/FCl/FClpevsbl621.log.gz
      ...adding FCl_Bond_Length_6-21G.spt
  ...jmolApplet3
      ...adding FCl_Bond_Length_6-31G.png
copying and unzipping jsmol.zip directory into /Users/student/Documents/GRLG/FCl
      ...copying
file:/Users/student/Desktop/FCl/FClpevsbl631.log
         to
      ...compressing large data file to
/Users/student/Documents/GRLG/FCl/FClpevsbl631.log.gz
/Users/student/Documents/GRLG/FCl/FClpevsbl631.log.gz
      ...adding FCl_Bond_Length_6-31G.spt
  ...jmolApplet4
      ...adding FCl_Bond_Length_DZV.png
copying and unzipping jsmol.zip directory into /Users/student/Documents/GRLG/FCl
      ...copying
file:/Users/student/Desktop/FCl/FClam1GODZV.log
         to
/Users/student/Documents/GRLG/FCl/FClam1GODZV.log
      ...adding FCl_Bond_Length_DZV.spt
  ...jmolApplet5
      ...adding FCl_HOMO__MO__6_.png
copying and unzipping jsmol.zip directory into /Users/student/Documents/GRLG/FCl
      ...adding FCl_HOMO__MO__6_.spt
  ...jmolApplet6
      ...adding FCl_LUMO__MO_6_.png
copying and unzipping jsmol.zip directory into /Users/student/Documents/GRLG/FCl
      ...adding FCl_LUMO__MO_6_.spt
  ...jmolApplet7
      ...adding FCl_Electrostatic_Potential.png
copying and unzipping jsmol.zip directory into /Users/student/Documents/GRLG/FCl
      ...adding FCl_Electrostatic_Potential.spt
  ...jmolApplet8
      ...adding FCl_Partial_Atomic_Charge.png
copying and unzipping jsmol.zip directory into /Users/student/Documents/GRLG/FCl
      ...adding FCl_Partial_Atomic_Charge.spt