Carbon Dioxide (CO2)
The MO Calculations for Carbon Dioxide (CO2) |
For Carbon Dioxide, the best calculated bond length was determined from the 6-21G and the 6-31G levels of theory. Both yielded a 1.81% error in comparison to the literature values found on the NIST website.5 Therefore, we adopted the 6-21G level for the following calculations. Table 1: Bond length for all ab initio levels of theory and the literature value.
The geometry of CO2 under 6-21G, 6-31G, and DZV are shown in Figures 1-3. The bond angles are not shown because the molecule is linear.
| ||||||||||||||||||||||||
|
| ||||||||||||||||||||||||
|
| ||||||||||||||||||||||||
|
Figure 4
shows the Highest Occupied Molecular Orbital (HOMO); it found at
orbital 11 by dividing the sum of the total number of electrons in
the molecule by 2. The Lowest Unoccupied Molecular Orbital (LUMO), shown
in Figure 5, was found at
the next orbital - orbital 12. The LUMO is filled by the
excited valence electron(s) from the HOMO if the proper excitation occurs.
| ||||||||||||||||||||||||
|
| ||||||||||||||||||||||||
|
Figure 6 shows the electrostatic potential calculated using the 6-21G level of theory. A rainbow colored spectrum is used to distinguish between the lowest potential (red) to the highest potential (blue). The electrostatic potential shows the distribution of electrons in the molecule.7 Figure 7 shows the partial atomic charges for CO2 using the 6-21G level of theory. The oxygen atoms should have the more negative partial charge because they are more electronegative than carbon. Figure 8 and Figure 9 show possible primary motions associated with the peaks in the IR Spectrum shown in Figure 10. Oscillation for CO2 in Figure 8 is found at 716.99 nm, while bond stretching in Figure 9 is found at 2384.1 nm on the spectrum.
| ||||||||||||||||||||||||
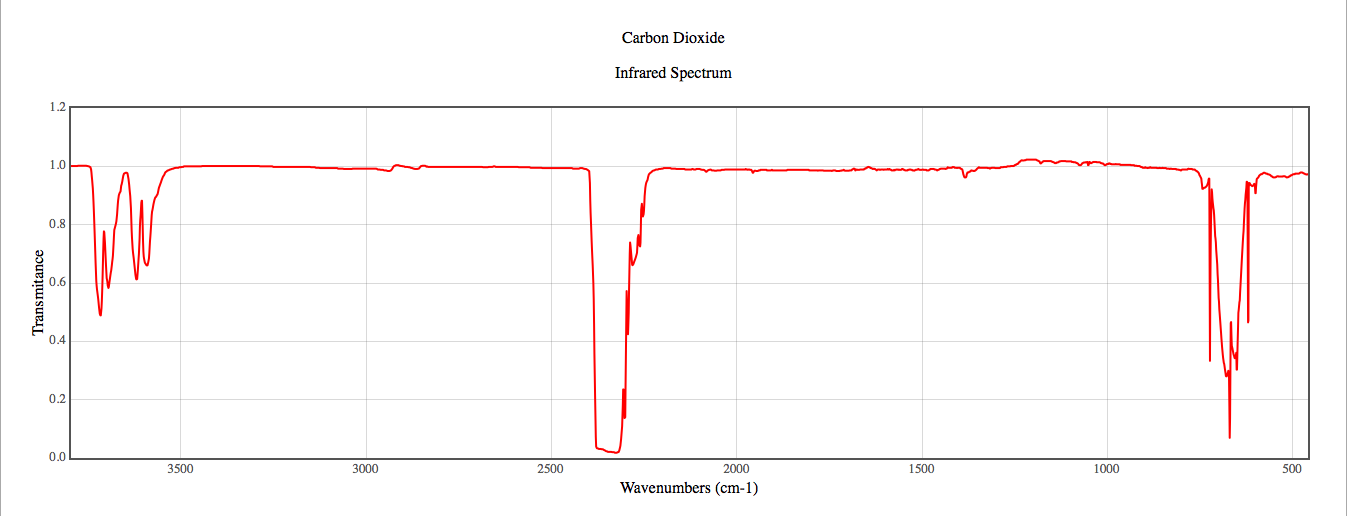 Figure 10: Infrared Spectrum for Carbon Dioxide. | ||||||||||||||||||||||||
|
Because CO2 is a non-polar moleculre, our calculations gave us 0.0 Db for a dipole moment. | ||||||||||||||||||||||||
|
|
Page skeleton and JavaScript generated by export to web function using Jmol 14.2.12_2015.01.22 2015-01-22 21:48 on Mar 3, 2015.