Once the molecule file is fully loaded the image at right will become live. At that time the "activate 3-D" icon
![]()
will disappear.
The geometry optimizations for the three
highest levels of theory are shown below. The following graphics
show the bond lengths and then the bond angles. The literature
4
gave a C-C bond length of 1.53 angstroms, C-H bond length of 1.084
angstroms and C-Br bond length of 1.937 angstroms. The literature
also gave internal bond angles of 120 degrees. The three levels of
theory gave very similar bond lengths and angles such that they were not
significantly different from one another. Because of this DZV was
selected as the 'best' geometry optimization purely because it had the
largest basis set.
The bond lengths for 3-21G, 6-31G, and DZV for bromobenzene.
The bond angles for bromobenze using 3-21G, 6-31G and DZV theory.
This is the highest occupied molecular orbital at
orbital 38. The orbitals were calculated by summing the amount of
electrons in the molecule and dividing by two.
This is the lowest unoccupied molecular orbital at
orbital 39. This would become occupied if the molecule was excited
with the proper amount of energy.
This is the electrostatic potential of the molecule. The red area
represents the lowest electrostatic potential and blue represents the
highest electrostatic potential. Intermediate colors represent
intermediate potentials.
The partial atomic charge on each atom is shown in
this diagram. They are created by the asymmetric distribution of
electrons in a chemical bond.
The vibrational frequencies were calculated using the
highest level of theory, DZV. These vibrations would show
up on a IR spectrum
5 of the molecule, which is shown in figure 1.
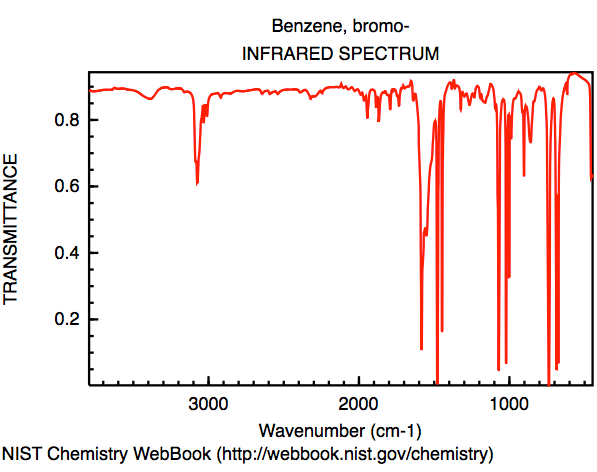
Figure 1: IR spectrum of brombenzene. Spectrum spans 500 to 4000 cm-1.
This vibration is associated with C-H stretching.
This vibration is associated with C-C stretching in the ring.
This vibration is associated with C-H oscillations.
This vibration is associated with C-Br stretching.
This vibration is associated with C-H wag.
This vibration is associated with C-Br stretching.
This vibration is associated with C-C stretching in the ring.
The UV peaks on a UV-vis spectrum were calculated and
are shown in table 1. These are what are expected to be in an
actual UV-vis spectra.
Table 1: The calculated values for peaks on a UV-vis
spectra. The oscillator strength shows the probability of that
peak being on the graph.
Oscillator strength (unitless)
|
Wavelength nanometers (nm)
|
.019393
|
189.7
|
1.541675
|
149.21
|
1.051824
|
147.63
|
No UV-vis spectra could be found for bromobenzene but
a table
6 of experimental peaks was found for bromobenzene and is shown
in table 2.
Table 2: The experimental values for Bromobenzene peaks in a UV-vis spectra. Note that the literature only gave two wavelengths.
The dipole moment was calculated at different levels
of theory to find the value closest to the experimental value. The
experimental
7 value was found to be 0.06 Debyes indicating a very small
but present dipole moment. The calculated values however varied from
1.449615 Debyes (AM1) to 2.395946 Debyes (6-31G) indicating a much
larger dipole moment. The very significant difference between these two
values indicates that levels of theory used are not effective at
calculating the dipole moment for this molecule.
You may look at any of these intermediate views again by clicking on the appropriate button.
Based on template by A. Herráez as modified by J. Gutow
Using directory /Users/student/Desktop/AN371/Website/Bromobenzene
  adding JmolPopIn.js
  ...jmolApplet0
      ...adding 3-21G_Bond_Lengths.png
copying and unzipping jsmol.zip directory into /Users/student/Desktop/AN371/Website/Bromobenzene
      ...copying
file:/Users/student/Desktop/AN371/Bromobenzene/bromobenzene-321G.log
         to
      ...compressing large data file to
/Users/student/Desktop/AN371/Website/Bromobenzene/bromobenzene-321G.log.gz
/Users/student/Desktop/AN371/Website/Bromobenzene/bromobenzene-321G.log.gz
      ...adding 3-21G_Bond_Lengths.spt
  ...jmolApplet1
      ...adding 6-31G_Bond_Lengths.png
copying and unzipping jsmol.zip directory into /Users/student/Desktop/AN371/Website/Bromobenzene
      ...copying
file:/Users/student/Desktop/AN371/Bromobenzene/bromobenzene-631G.log
         to
      ...compressing large data file to
/Users/student/Desktop/AN371/Website/Bromobenzene/bromobenzene-631G.log.gz
/Users/student/Desktop/AN371/Website/Bromobenzene/bromobenzene-631G.log.gz
      ...adding 6-31G_Bond_Lengths.spt
  ...jmolApplet2
      ...adding DZV_Bond_Lengths.png
copying and unzipping jsmol.zip directory into /Users/student/Desktop/AN371/Website/Bromobenzene
      ...adding DZV_Bond_Lengths.spt
  ...jmolApplet3
      ...adding 3-21G_Bond_Angles.png
copying and unzipping jsmol.zip directory into /Users/student/Desktop/AN371/Website/Bromobenzene
      ...adding 3-21G_Bond_Angles.spt
  ...jmolApplet4
      ...adding 6-31G_Bond_Angles.png
copying and unzipping jsmol.zip directory into /Users/student/Desktop/AN371/Website/Bromobenzene
      ...adding 6-31G_Bond_Angles.spt
  ...jmolApplet5
      ...adding DZV_Bond_Angles.png
copying and unzipping jsmol.zip directory into /Users/student/Desktop/AN371/Website/Bromobenzene
      ...adding DZV_Bond_Angles.spt
  ...jmolApplet6
      ...adding HOMO_Bromobenzene.png
copying and unzipping jsmol.zip directory into /Users/student/Desktop/AN371/Website/Bromobenzene
      ...copying
file:/Users/student/Desktop/AN371/Bromobenzene/bromobenzene-DZV.log
         to
      ...compressing large data file to
/Users/student/Desktop/AN371/Website/Bromobenzene/bromobenzene-DZV.log.gz
/Users/student/Desktop/AN371/Website/Bromobenzene/bromobenzene-DZV.log.gz
      ...adding HOMO_Bromobenzene.spt
  ...jmolApplet7
      ...adding LUMO_Bromobenzene.png
copying and unzipping jsmol.zip directory into /Users/student/Desktop/AN371/Website/Bromobenzene
      ...adding LUMO_Bromobenzene.spt
  ...jmolApplet8
      ...adding Electrostatic_Potential_Bromobenzene.png
copying and unzipping jsmol.zip directory into /Users/student/Desktop/AN371/Website/Bromobenzene
      ...adding Electrostatic_Potential_Bromobenzene.spt
  ...jmolApplet9
      ...adding Partial_atomic_charges.png
copying and unzipping jsmol.zip directory into /Users/student/Desktop/AN371/Website/Bromobenzene
      ...adding Partial_atomic_charges.spt
  ...jmolApplet10
      ...adding 3400_IR_Vib.png
copying and unzipping jsmol.zip directory into /Users/student/Desktop/AN371/Website/Bromobenzene
      ...copying
file:/Users/student/Desktop/AN371/Bromobenzene/bromobenzene-DZVvib.log
         to
      ...compressing large data file to
/Users/student/Desktop/AN371/Website/Bromobenzene/bromobenzene-DZVvib.log.gz
/Users/student/Desktop/AN371/Website/Bromobenzene/bromobenzene-DZVvib.log.gz
      ...adding 3400_IR_Vib.spt
  ...jmolApplet11
      ...adding 1700_Ring_Stretch_Vib.png
copying and unzipping jsmol.zip directory into /Users/student/Desktop/AN371/Website/Bromobenzene
      ...adding 1700_Ring_Stretch_Vib.spt
  ...jmolApplet12
      ...adding 1469_IR_Vib.png
copying and unzipping jsmol.zip directory into /Users/student/Desktop/AN371/Website/Bromobenzene
      ...adding 1469_IR_Vib.spt
  ...jmolApplet13
      ...adding 1185_IR_Vib.png
copying and unzipping jsmol.zip directory into /Users/student/Desktop/AN371/Website/Bromobenzene
      ...adding 1185_IR_Vib.spt
  ...jmolApplet14
      ...adding 1007_IR_Vib.png
copying and unzipping jsmol.zip directory into /Users/student/Desktop/AN371/Website/Bromobenzene
      ...adding 1007_IR_Vib.spt
  ...jmolApplet15
      ...adding 727_IR_Vib.png
copying and unzipping jsmol.zip directory into /Users/student/Desktop/AN371/Website/Bromobenzene
      ...adding 727_IR_Vib.spt
  ...jmolApplet16
      ...adding 681_IR_Vib.png
copying and unzipping jsmol.zip directory into /Users/student/Desktop/AN371/Website/Bromobenzene
      ...adding 681_IR_Vib.spt