Once the molecule file is fully loaded, the image at right will become live. At that time the "activate 3-D" icon ![]() will disappear.
will disappear.
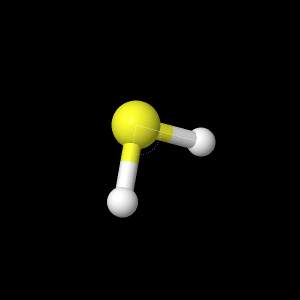
Hydrogen Sulfide
Below are the 3 levels of theory observed for optimized
geometries, bond angles and lengths for each level of theory are shown. Table 1: Bond Length and Angle from Literature
| H-S Bond |
1.3356 Angstroms |
| S-H-S Angle |
92.11 Degrees |
Table 2: Dipole moments for each level of theory
| Theory |
Dipole (Debyes) |
| 6-21G |
1.85049 |
| 6-31G |
1.86605 |
| AM1 |
1.85971 |
| DZV |
1.84473 |
| PM3 |
1.77531 |
Adding diffuse functions to the best level of theory DZV, values are closer to the experimental value of 0.970 Debye.
Table 3: Dipole moments of DZV level of theory after adding diffuse functions.
| Diffuse Functions (DZV) |
Dipole (Debyes) |
| 300 |
1.02607 |
| 310 |
1.03523 |
| 301 |
1.05129 |
| 311 |
1.05101 |
Figure 1: Experimental IR spectrum of Hydrogen Sulfide
Below are animations of each observable and notable peaks in the IR spectra that was calculated by the DZV level of theory. Each value is in wavenumbers.
The only real useful peak that is definitive in IR
spectra with sulfer is the S-H stretch that is observed around the
2500-2600 range.
The peaks match up fairly well, the stretching peak shows up at around 2700 wavenumbers, and the S-H wobble is reflected in the very intense peaks around 1300 wavenumbers.
The peaks match up fairly well, the stretching peak shows up at around 2700 wavenumbers, and the S-H wobble is reflected in the very intense peaks around 1300 wavenumbers.
Page skeleton and JavaScript generated by export to web function using Jmol 14.2.15_2015.07.09 2015-07-09 22:22 on Feb 29, 2016.
This will be the viewer
If your browser/OS combination is Java capable, you will get snappier performance if you use Java