-Styrene-
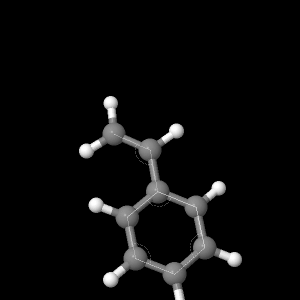
Styrene is a moderately sized aromatic
product that is a derivative of ethyl benzene, and is a
precursor to polystyrene which is commonly known as
"Styrofoam". The structure of styrene is a planar benzene
ring with a vinyl group substituted in for a hydrogen. To
theoretically compute the molecular geometry for styrene,
a 3 dimensional rendering of styrene was generated and
evaluated using several different basis sets in the
Hartree Fock Self Consistent Field (HF-SCF) method.
Starting with a MOPAC basis set (AM-1), and feeding the
lowest energy geometry into the next largest basis set
(AM-1 -> 621-G -> 631-G -> DZV), the molecular
dimensions were optimized at different levels of theory.
Table #1 shows the accepted literature dimensions for bond
lengths in aromatic compounds; clicking on the buttons
below will show renderings of styrene at the end of each
basis set calculation.
Seeing the stated value in table
#1, the calculated basis sets all calculated close
bond lengths for the carbon= carbon bonds in
styrene.
Table #1: Literature bond
lengths for aromatic carbon-carbon double bonds1
| Bond type |
Bond length (nm) |
| C=C |
0.1395 |
|
|
|
|
|
|
|
|
---Molecular
Surfaces---
Using the optimized geometry from the DZV basis set, various renderings were generated describing the physical properties of the molecule.
The molecular orbitals for Styrene were generated. The Highest Occupied Molecular Orbital (HOMO) and the Lowest Unoccupied Molecular Orbital (LUMO) were rendered, and their placement on the molecule can be seen by clicking the buttons below. Note that the different colors of the orbitals (red and blue) indicate the parity of the orbitals, and can be thought of as the + or - seen in two dimensional pictures. Observing the shape of the HOMO orbital on styrene, these are the p orbitals on the sp2 hybridized carbons that are oriented orthogonal to the planar ring structure. The electrons found in the HOMO orbital are the electrons responsible for π bonds; the bonds that give styrene the aromatic conjugated nature and ultraviolet/Visible light absorbing capabilities that will be discussed in a little bit.
|
|
|
|
A surface of the molecular electrostatic potential was also applied to the molecule to iterate the difference in charge density. The standard unit of electric potential is the volt, but here the concept is purely to iterate the spatial charge separation in the molecule as a consequence of electronegativity and atomic orbital energy levels. The red color indicates the enhanced presence of electrons in that region, and therefore a higher negatively charged zone. To see the colorful rendering of the electrostatic potential, click the button below.
|
|
Observing the electrostatic potential for styrene, most of the red color is seen at the center of the ring at the heart of the conjugated pi bonding system. However, the electrostatic potential in this molecule is not as spatially imbalanced as hydrogen sulfide, and has a more smooth distribution of charge throughout the structure. The dipole moment of the molecule was calculated using the different levels of theory, and reported in table #2 below.
Table #2: Dipole moments of Styrene
(Debeye)
| AM-1 |
621-G |
631-G |
DZV |
Literature1 |
| 0.020866 |
0.085920 |
0.138244 |
0.167534 |
0.13 |
Here the best dipole moment was calculated using 631-G basis set when comparing to the literature value of Debeye. It appears that the increased basis sets began to bring the nuclei too close together, but it is possible that the orbitals were not diffused enough to match the literature dipole moment of the molecule. The dipole moment of styrene is relatively small when compared to polar entities like hydrogen fluoride, but there is some separation of charge in styrene due to small electronegativity differences between hydrogen and carbon leading to partial charge distribution. To see the partial charge distribution of styrene click on the button below.
|
|
--Molecular Dynamics of
Styrene--
Like many conjugated aromatic compounds, styrene is an active
ultraviolet-visible light absorber - making it detectable and
quantifiable using UV-Vis spectrometry. The π electrons found in
the HOMO orbital can absorb photons (light energy), and become
energetically promoted to the LUMO orbital. Go back and take a
look at the HOMO and LUMO orbitals to observe how the HOMO level
is primarily bonding for 3 nuclei on each side of the ring where
the LUMO is slightly higher in energy due to increased
anti-bonding in the molecule.Using the calculated separation of energy between the orbitals, the UV-Vis absorbances were calculated for styrene in wavelengths and in wavenumbers. Transition energies were calculated using the ab-initio basis sets and entered into table #3.
Table #3: Theoretical UV-Visible
Spectroscopy Absorbances for Styrene
| 621-G |
631-G |
DZV |
||||
| Transition |
Wavenumber (cm-1) |
λ (nm) |
Wavenumber (cm-1) |
λ (nm) |
Wavenumber (cm-1) |
λ (nm) |
| G -->1 |
49869.55 |
200.5232 |
48335.65 |
206.8866 |
46443.50 |
215.3154 |
| G -->3 |
62678.19 |
159.5451 |
61041.20 |
163.8238 |
58892.45 |
169.8011 |
| G -->4 |
66973.69 |
149.3301 |
65369.74 |
152.9760 |
63069.18 |
158.5560 |
| G -->6 |
74762.16 |
133.7575 |
73717.43 |
135.6531 |
72060.90 |
138.7715 |
| G -->7 |
76617.02 |
130.5193 |
75260.06 |
132.8726 |
---------- |
------- |
By observing a literature UV-Vis spectra for styrene in figure #1, the molecule absorbs strongly between wavelengths of 220nm and 255nm with a peak absorbance at 245nm. When comparing the literature spectra with the calculated results, it appears that the entire calculated spectra is centered around 169.8011nm (DZV, G -->3), and is as tightly grouped as the literature spectra, but the whole lot of calculated wavelengths appears to be shifted to a much higher frequency (and energy) light. Considering that these molecules are almost perfectly planar, it could be possible that in a physical sample, molecules "stack up" and the orthogonal orbitals interact with each other, allow for electrons to dissipate into a larger region, and lower the energy of the transitions.
Figure #1: Literature UV-Vis Spectra
For Styrene2

The bonds in Styrene can be made to move in
an oscillating motion by exposure to infrared radiation. The
energy separation between the vibrational modes in styrene
were calculated and translated into corresponding
wavenumbers for each molecular absorption. Figure #2 shows
an IR spectra for styrene, and the buttons below show the
molecular animations of the movements associated with each
peak absorption in the spectra.

Figure #2: Literature IR spectra
of Styrene3
|
|
|
|
|
|
|
|
|
|
-References-
1) Lide,D.R.,Kehiaian,H.V. CRC
Handbook of Chemistry and Physics; CRC Press, Boca Raton,
FL, 1973; Sec F, pg 219, Sec E, pg 63.
2) NIST Standard Reference Database, 2013, accssed Mar, 5, 2013. http://webbook.nist.gov/cgi/cbook.cgi?ID=C100425&Units=SI&Mask=608#UV-Vis-Spec
3) Sigma Aldrich Online Catalog: http://www.sigmaaldrich.com/spectra/rair/RAIR005131.PDF
2) NIST Standard Reference Database, 2013, accssed Mar, 5, 2013. http://webbook.nist.gov/cgi/cbook.cgi?ID=C100425&Units=SI&Mask=608#UV-Vis-Spec
3) Sigma Aldrich Online Catalog: http://www.sigmaaldrich.com/spectra/rair/RAIR005131.PDF
Page
skeleton and JavaScript generated by export to web function
using Jmol 12.2.34
2012-08-09 20:37 on Feb 26, 2013.