-Hydrogen Sulfide-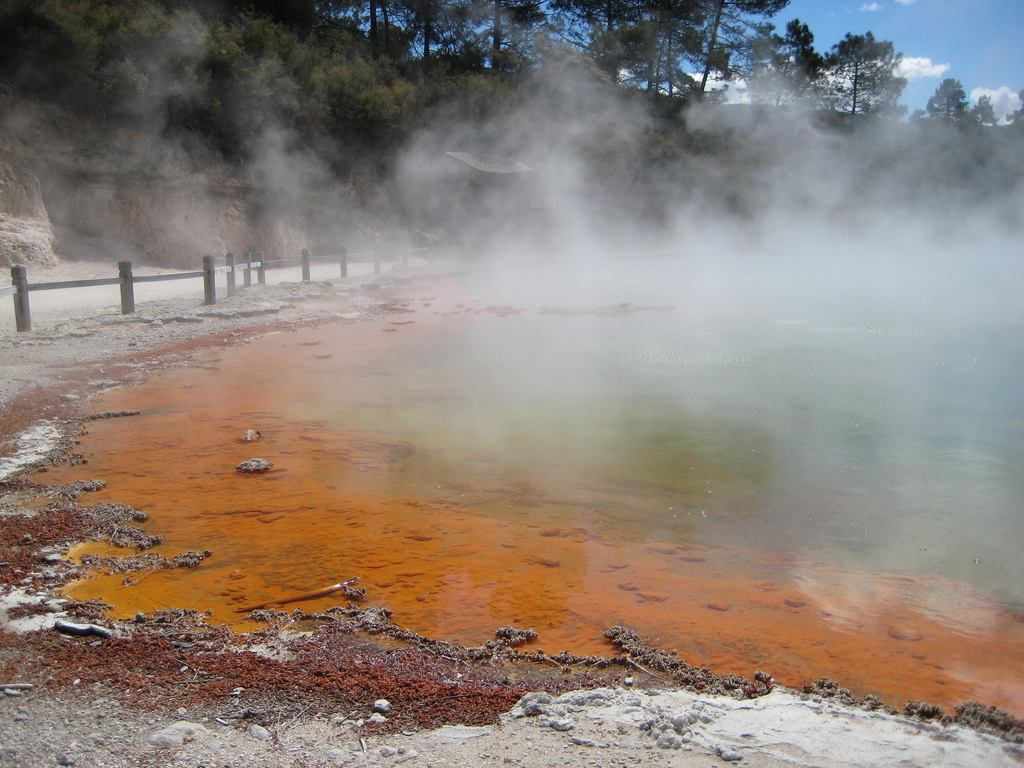
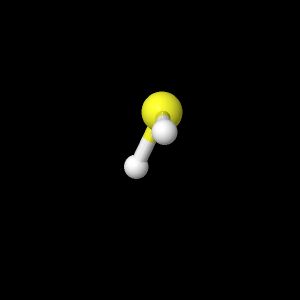
Hydrogen sulfide is a small polar molecule which exists as a colorless, flammable and toxic gas. This foul smelling compound occurs naturally in petroleum sources and in volcanic terrain. The molecular geometry of hydrogen sulfide resembles the bent geometry seen in water molecules.
To theoretically calculate the geometry of this molecule, The Hartree Fock self consistent field (HF-SCF) method was applied using increasing basis sets. Starting with a MOPAC basis set (AM-1), and feeding the lowest energy geometry into the next largest basis set (AM-1 -> 621-G -> 631-G -> DZV), the molecular dimensions were calculated at these different levels of theory.
Table #1: Calculated Molecular
dimensions of different basis sets
| H-S-H bond angle (degrees) |
S-H bond length (nm) |
|
| AM-1 |
95.1 |
0.132 |
| 621-G |
96.1 |
0.135 |
| 631-G |
96.2 |
0.135 |
| DZV |
96.2 |
0.135 |
| Literature1 |
93.3 |
0.13455 |
By observing table #1, as the basis set size increased, the bond length between the sulfur and the hydrogen approached the literature value of 0.13455nm showing that the Double Zeta Valence (DZV) basis set yielded the lowest energies at that atomic distance. However, as the basis set increased the bond angle began to deviate slightly more than the literature angle of 93.3 degrees.
To view the animations generated after each different HF-SCF basis set iteration, and to view the computer calculations of the bond lengths and angles, click on the buttons below to toggle between different basis set renderings.
|
|
|
|
|
|
|
|
---Molecular Surfaces---
Using the optimized geometry from the DZV basis set, various renderings were generated describing the physical properties of the molecule.
The molecular orbitals for hydrogen sulfide were generated. The Highest Occupied Molecular Orbital (HOMO) and the Lowest Unoccupied Molecular Orbital (LUMO) were rendered, and their placement on the molecule can be seen by clicking the buttons below. Note that the different colors of the orbitals (red and blue) indicate the parity of the orbitals, and can be thought of as the + or - seen in two dimensional pictures.
|
|
|
|
A surface of the molecular electrostatic potential was also applied to the molecule to iterate the difference in charge density. The standard unit of electric potential is the volt, but here the concept is purely to iterate the spatial charge separation in the molecule as a consequence of electronegativity and atomic orbital energy levels. The red color indicates the enhanced presence of electrons in that region, and therefore a higher negatively charged zone. To see the colorful rendering of the electrostatic potential, click the button below.
|
|
The imbalance of electrons seen in the electrostatic potential lead to the nuclei within the molecule carrying partially positive or partially negative
charges. the button below will show a live picture with values for these partial charges.
|
|
Another consequence of the imbalance of electrons is the presence of dipoles within the molecule, and a total molecular dipole. Molecular dipoles were calculated using all three basis sets. However, the sulfur atom has available unoccupied d orbitals which electrons may disperse into; to account for this phenomenon in this theoretical calculation, additional diffuse d functions were added to the calculation to replicate the natural dispersion of the electrons. Dipole moments calculated in these trials are reported in table #2.
Table #2: Calculated Molecular Dipoles
| Basis set used (# diffuse
functions) |
Dipole moment (Debeye) |
| AM-1 |
1.859680 |
| 621-G |
1.850457 |
| 631-G |
1.866086 |
| DZV |
1.844673 |
| DZV (1S,1D) |
1.375594 |
| DZV (2S,2D) |
1.1536603 |
| DZV (3S,3D) |
1.038927 |
| Literature1 |
0.970 |
Using the non-diffused basis sets, the calculations yield dipole moments that are significantly higher than the literature values, but as more and more diffuse functions were added, and the spatial distribution of the electrons began to resemble a nuclei with available d orbitals, the dipole moment began to get much closer to the excepted value. The DZV data set with 3 diffuse D functions and 3 diffuse S functions had the closest dipole moments with respect to literature values.
--Vibrational Modes of Hydrogen
Sulfide--
Finally, the energies between the
vibrational molecular transitions were calculated using the
DZV basis set, and the corresponding wavenumber was assigned
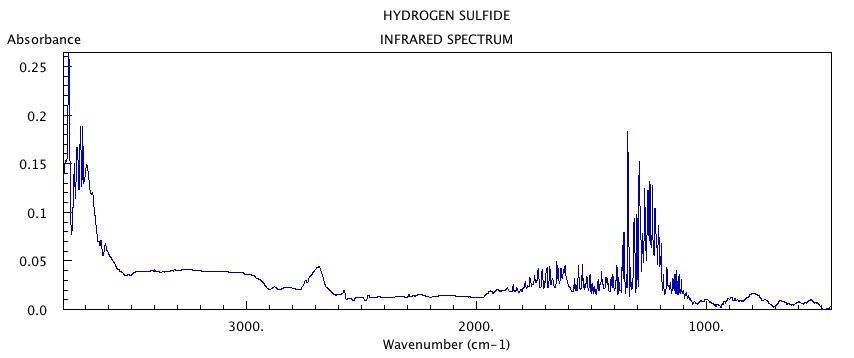
to each transition. Three primary vibrational transitions
were calculated in this molecule: at 2700cm-1, asymmetrical
stretch is observed; at 2650cm-1, a symmetrical stretch is
observed; at 1320cm-1, "scissoring" is observed in the
molecule. These modes also show up as peaks in the infrared
spectra for hydrogen sulfide as seen in figure #1. To see
animations of each stretching mode, click the buttons seen
below the infrared spectra.
Figure #1: FT-IR Spectra of Hydrogen Sulfide2
Figure #1: FT-IR Spectra of Hydrogen Sulfide2
|
|
|
|
|
|
--References--
1) Lide,D.R.,Kehiaian,H.V. CRC Handbook of Chemistry and Physics; CRC Press, Boca Raton, FL, 1973; Sec F, pg 219, Sec E, pg 63.
2) NIST Standard Reference Database, 2013, accssed Mar, 5, 2013. http://webbook.nist.gov/cgi/cbook.cgi?ID=C7783064&Mask=80#IR-Spec
Page
skeleton and JavaScript generated by export to web function
using Jmol 12.2.34
2012-08-09 20:37 on Feb 26, 2013. "we got this sh**
dialed in"