Benzaldehyde
Benzaldehyde is the only aromatic molecule
studied in this experiment. In addition to the computations performed on
the other
molecules the IR vibrational spectrum was reported and each peak was
labeled with a live display of each primary motion associated with it,
and a table of UV-Vis absorption peaks and experimental peaks was
reported.
The best optimized geometry came from the DZV (Double Zeta Valence) level of ab initio calculations.
DZV calculations contained the largest basis set of the computational
sets used in this lab and gave the lowest energy geometry of all used
levels of calculation. The partial atomic charges were calculated by
wxMacMolPlt software and reported in the live display over each atom.
| ||||||
The optimized geometry calculated by the 6-21G computational package
live image is shown here.
| ||||||
The optimized geometry calculated by the 6-31G computational package
live image is shown here.
| ||||||
This live display shows the electrostatic potential mapped on the
molecular surface calculated from the best optimized geometry of the
molecule.
| ||||||
The highest occupied molecular orbital (HOMO) is
shown in the live display. The HOMO is the highest energy level that is
occupied by electrons in the molecule.
| ||||||
The lowest unoccupied molecular orbital (LUMO) is shown in the live
display. This is the lowest energy orbital that does not contain
electrons.
The benzaldehyde IR spectrum is shown below with each vibrational frequency (labeled A-J) shown as live display underneath. The circled area of the spectrum is not an observed vibration in the molecule, but rather a combination band likely caused by peaks C and G being observed together. Some similar vibrations were observed at the same wavenumber due to the same atoms vibrating at the same time, the best representation of the vibration was chosen as the peak. 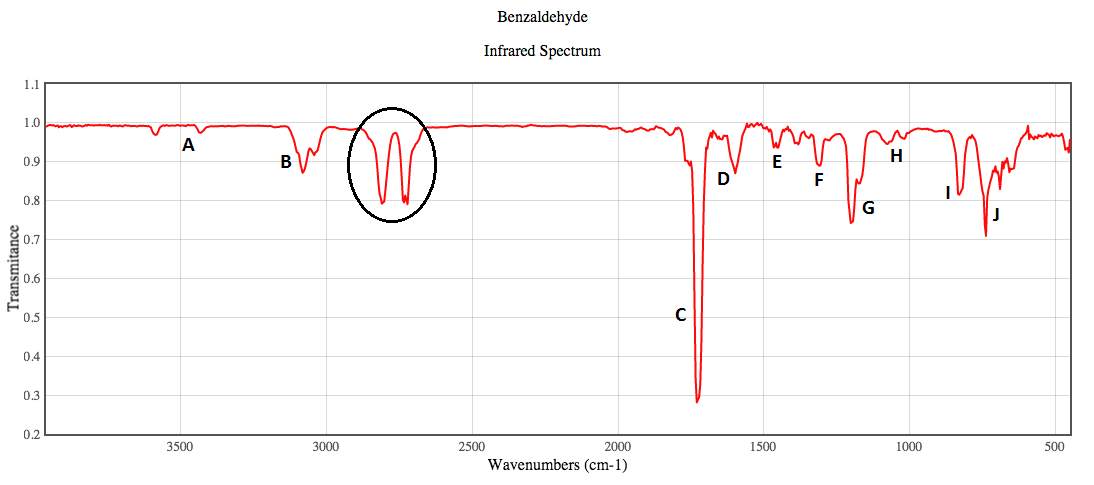 | ||||||
Vibration A is shown here with a wavenumber of 3416.07 cm-1.
| ||||||
Vibration B is shown here with a wavenumber of 3243.32 cm-1.
| ||||||
Vibration C is shown here with a wavenumber of 1771.02 cm-1.
| ||||||
Vibration D is shown here with a wavenumber of 1609.5 cm-1.
| ||||||
Vibration E is shown here with a wavenumber of 1481.67 cm-1.
| ||||||
Vibration F is shown here with a wavenumber of 1335.02 cm-1.
| ||||||
Vibration G is shown here with a wavenumber of 1282.75 cm-1.
| ||||||
Vibration H is shown here with a wavenumber of 1094.36 cm-1.
| ||||||
Vibration I is shown here with a wavenumber of 867.94 cm-1.
| ||||||
Vibration J is shown here with a wavenumber of 709.27 cm-1.
|
| The UV-Vis calculated peaks for benzaldehyde are shown at each level of theory, the values are reported in inverse centimeters. |
||
| DZV |
6-21G |
6-31G |
| 62452.26 |
65968.30 |
64074.96 |
| 64850.07 |
68187.83 |
66534.68 |
Page skeleton and JavaScript generated by export to web function using Jmol 14.2.15_2015.07.09 2015-07-09 22:22 on Mar 1, 2016.