Carbon Monoxide
Below is the data and results from the procedure described previously.
From the higher levels of theory, this is the
optimized geometry of carbon monoxide. As previously predicted, the
geometry is linear. The vibrational frequency is 2265.28 wavenumbers.
|
||||||
With the oxygen atom having eight electrons and the
carbon holding six, the total amount of molecular orbitals holding
electrons is seven. To the left is the seventh orbital (HOMO) and its
configuration. The color change depicts the change in sign of the
orbitals.
|
||||||
With carbon monoxide holding seven orbitals with
electrons, the eighth orbital is considered the LUMO due to no electrons
occupying the orbital. To the right is the configuration of the
LUMO.
|
||||||
The figure to the left shows the electrostatic
potential of each of the atoms in the molecule.The red shading
symbolizes that there is a high electron density while the blue shows a
low density. With oxygen being more electronegative, this result was
predicted with more electrons being drawn to the oxygen side of the
molecule.
|
||||||
Partial atomic charges are similar to the electrostatic
potential with showing that the more electronegative atom in the
molecule will draw more electrons to it making it have a more partial
negative charge. In this case, oxygen is more negative while carbon is
partially positive.
|
||||||
|
||||||
|
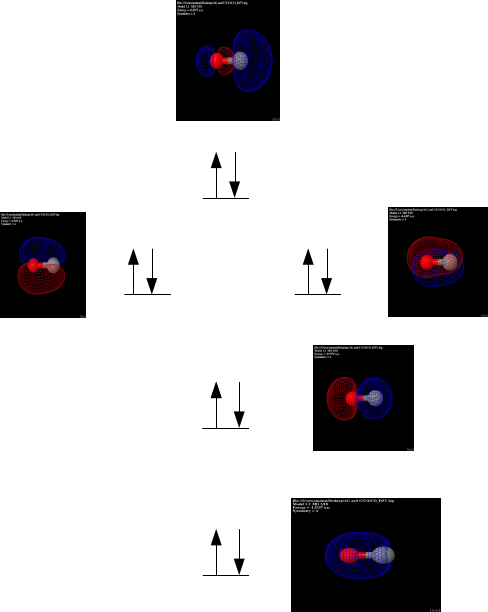
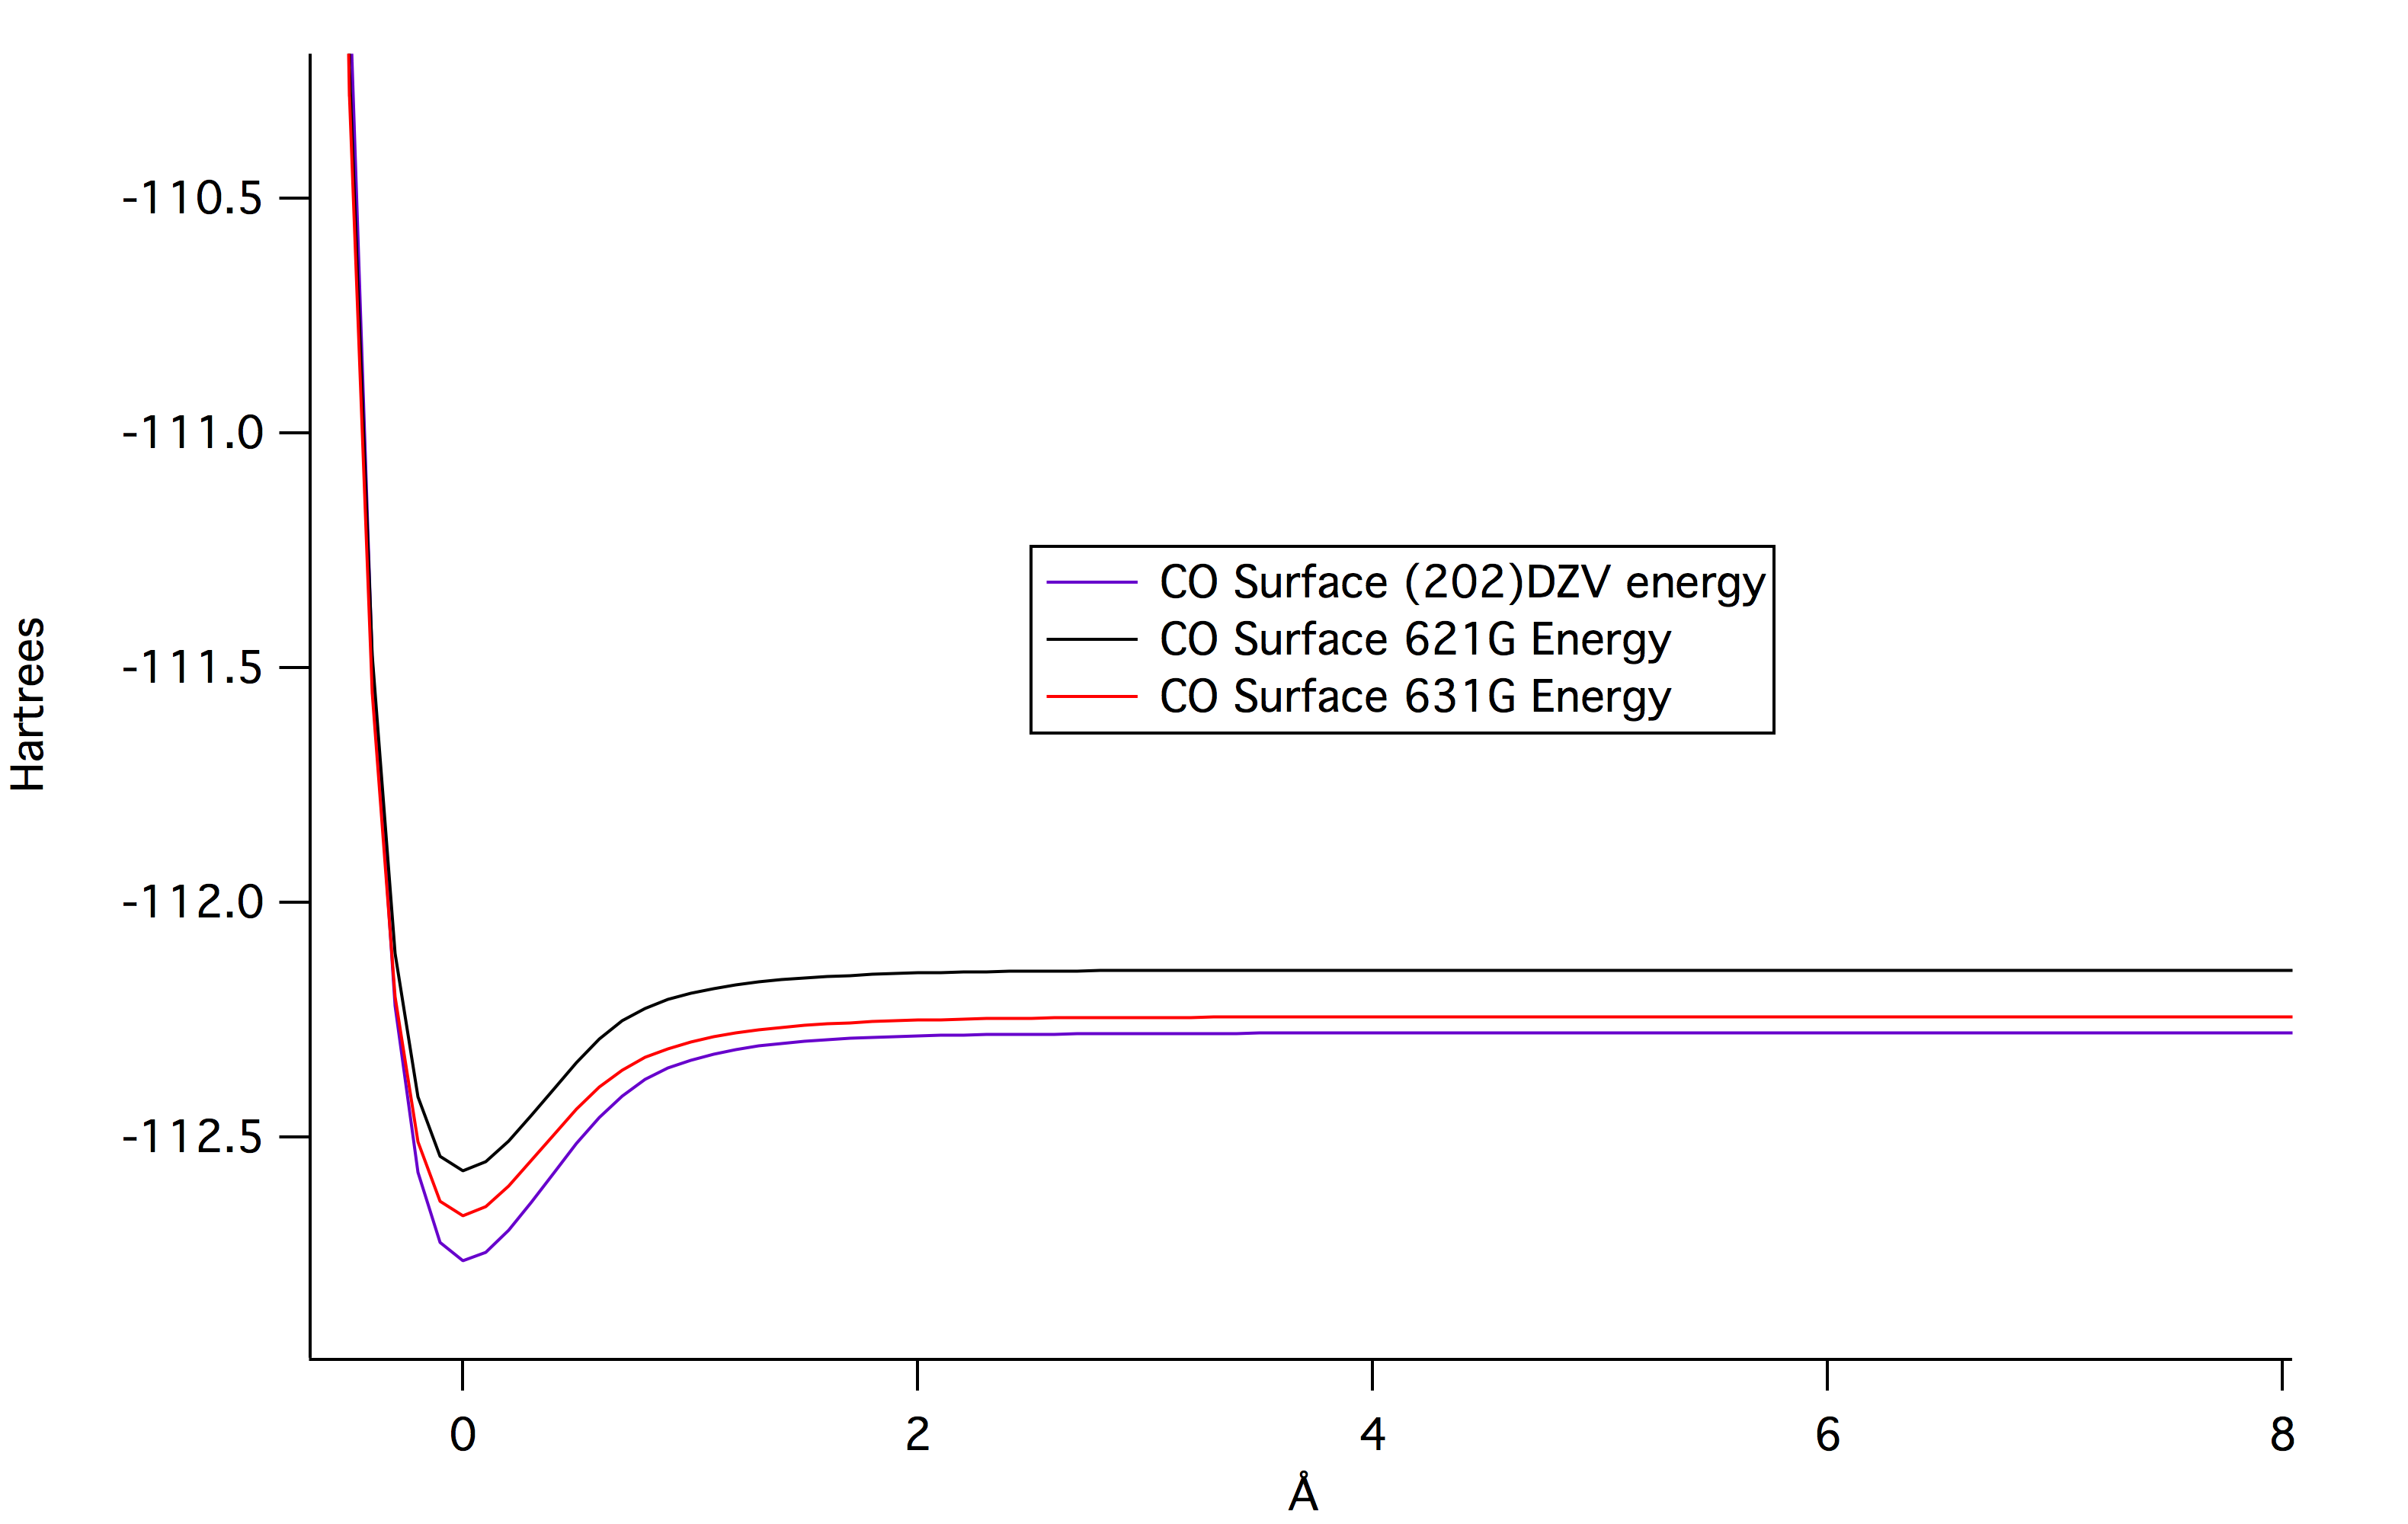
Table of Dipole Moments at Different Basis Sets
| Basis Set |
Dipole Moment (D) |
| 111 |
0.191334 |
| 313 |
0.150437 |
| 202 |
0.125074 |
Page skeleton
and JavaScript generated by export to web function using Jmol 14.1.8 2014-02-10
21:43: on Mar 3, 2014.