| # |
Frequency |
Intensity |
| 1 |
139.39 |
0.00369 |
| 2 |
16.16 |
0.00095 |
| 3 |
12.83 |
0.00172 |
| 4 |
2.54 |
0.00011 |
| 5 |
0.25 |
0 |
| 6 |
0.14 |
0 |
| 7 |
2.54 |
0.00018 |
| 8 |
179.75 |
0.00146 |
| 9 |
195.74 |
0.01734 |
| 10 |
283.08 |
0.19754 |
| 11 |
346.19 |
0.00516 |
| 12 |
433.96 |
0.0154 |
| 13 |
498.73 |
0.23631 |
| 14 |
552.66 |
0.03485 |
| 15 |
575.13 |
0.00031 |
| 16 |
634.85 |
0.02035 |
| 17 |
787.26 |
0.00076 |
| 18 |
810.96 |
0.00164 |
| 19 |
873.37 |
2.22425 |
| 20 |
903.2 |
0.00363 |
| 21 |
1014.71 |
0.00022 |
| 22 |
1092.12 |
0.01457 |
| 23 |
1102.77 |
0.00212 |
| 24 |
1105.48 |
0.02869 |
| 25 |
1154.91 |
0.00028 |
| 26 |
1161.62 |
0.16524 |
| 27 |
1182.77 |
0.16559 |
| 28 |
1203.98 |
0.00071 |
| 29 |
1254.69 |
0.13508 |
| 30 |
1290.72 |
0.01416 |
| 31 |
1312.52 |
0.00943 |
| 32 |
1348.43 |
0.00097 |
| 33 |
1379.71 |
0.01899 |
| 34 |
1452.96 |
0.00564 |
| 35 |
1578.15 |
0.08052 |
| 36 |
1585.77 |
0.12055 |
| 37 |
1606.15 |
0.13459 |
| 38 |
1639.42 |
0.05124 |
| 39 |
1643.57 |
0.35544 |
| 40 |
1662.11 |
0.06708 |
| 41 |
1663.34 |
0.57666 |
| 42 |
1666.34 |
0.4155 |
| 43 |
1774.28 |
0.04235 |
| 44 |
1803.25 |
0.05327 |
| 45 |
3197.41 |
0.88978 |
| 46 |
3200.15 |
1.54914 |
| 47 |
3266.94 |
0.87455 |
| 48 |
3271.98 |
0.95479 |
| 49 |
3308.96 |
0.81638 |
| 50 |
3333.32 |
0.75771 |
| 51 |
3360.33 |
0.65824 |
| 52 |
3367.95 |
0.21208 |
| 53 |
3388.93 |
1.17046 |
| 54 |
3413.95 |
0.88559 |
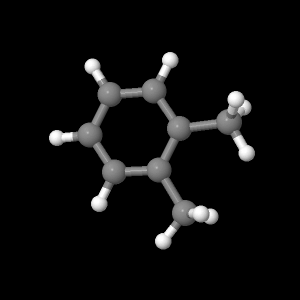
This spectrum was taken from the SDBS1. The values calculated look pretty decent to the values shown on the graph.
From this table, the three most prominent vibrations were found, click below to see these animated.
|
|
|
|
|
|
The UV-Vis values were also calculated, below is the UV-Vis calculations.
| Frequency(cm^-1) |
| 49991.47 |
| 51524.73 |
| 66148.55 |
| 66529.61 |
| 75331.40 |
| 77130.38 |
| 77722.45 |
| 78597.10 |
| 83150.16 |
| 83793.85 |
1.SDBS.http://riodb01.ibase.aist.go.jp/sdbs/cgi-bin/direct_frame_top.cgi
Page
skeleton and JavaScript generated by export to web function
using Jmol 12.2.RC3
2011-08-06 04:51 on Mar 1, 2012.