With the DZV calculations done, it was then possible to
calculate possible IR spectrum values. These values are in the
table below.
#
|
Frequency(cm^-1)
|
Intensity
|
1
|
6.11
|
0.12818
|
2
|
3.49
|
0.12458
|
3
|
0.06
|
0.00001
|
4
|
0.7
|
0.00748
|
5
|
2.52
|
0.04339
|
6
|
5.54
|
0.01729
|
7
|
319.95
|
0.26295
|
8
|
320.25
|
0.26248
|
9
|
438.29
|
1.25896
|
10
|
842.84
|
4.40102
|
11
|
842.96
|
4.40225
|
12
|
863.56
|
3.5237
|
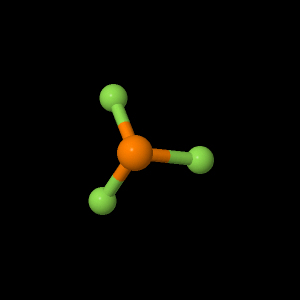
IR spectra could not be found of this molecule. The most
prominent vibrations are animated, to view click below.
Based on template by A. Herráez as modified by J. Gutow
Using directory /Users/student/Documents/GormanNate/Website stuff/PF3FINAL/PF3vibe
  adding JmolPopIn.js
  ...jmolApplet0
      ...adding PF3_10.png
      ...copying
./Jmol.js
         to
/Users/student/Documents/GormanNate/Website stuff/PF3FINAL/PF3vibe/Jmol.js
      ...copying
./JmolApplet.jar
         to
/Users/student/Documents/GormanNate/Website stuff/PF3FINAL/PF3vibe/JmolApplet.jar
      ...copying
file:/Users/student/Documents/GormanNate/DZV_PF3_vib.log
         to
      ...compressing large data file to
/Users/student/Documents/GormanNate/Website stuff/PF3FINAL/PF3vibe/DZV_PF3_vib.log.gz
/Users/student/Documents/GormanNate/Website stuff/PF3FINAL/PF3vibe/DZV_PF3_vib.log.gz
      ...adding PF3_10.spt
  ...jmolApplet1
      ...adding PF3_11.png
      ...adding PF3_11.spt
  ...jmolApplet2
      ...adding PF3_12.png
      ...adding PF3_12.spt