|
|
|
|
| The optimal calculated
bond length for diatomic chlorine is shown above. The bond angle
is 180 degrees. |
| Bond Length |
Bond Angle |
|
| Experimental-(3) |
1.9879 Å |
180 degrees |
|
|
|
|
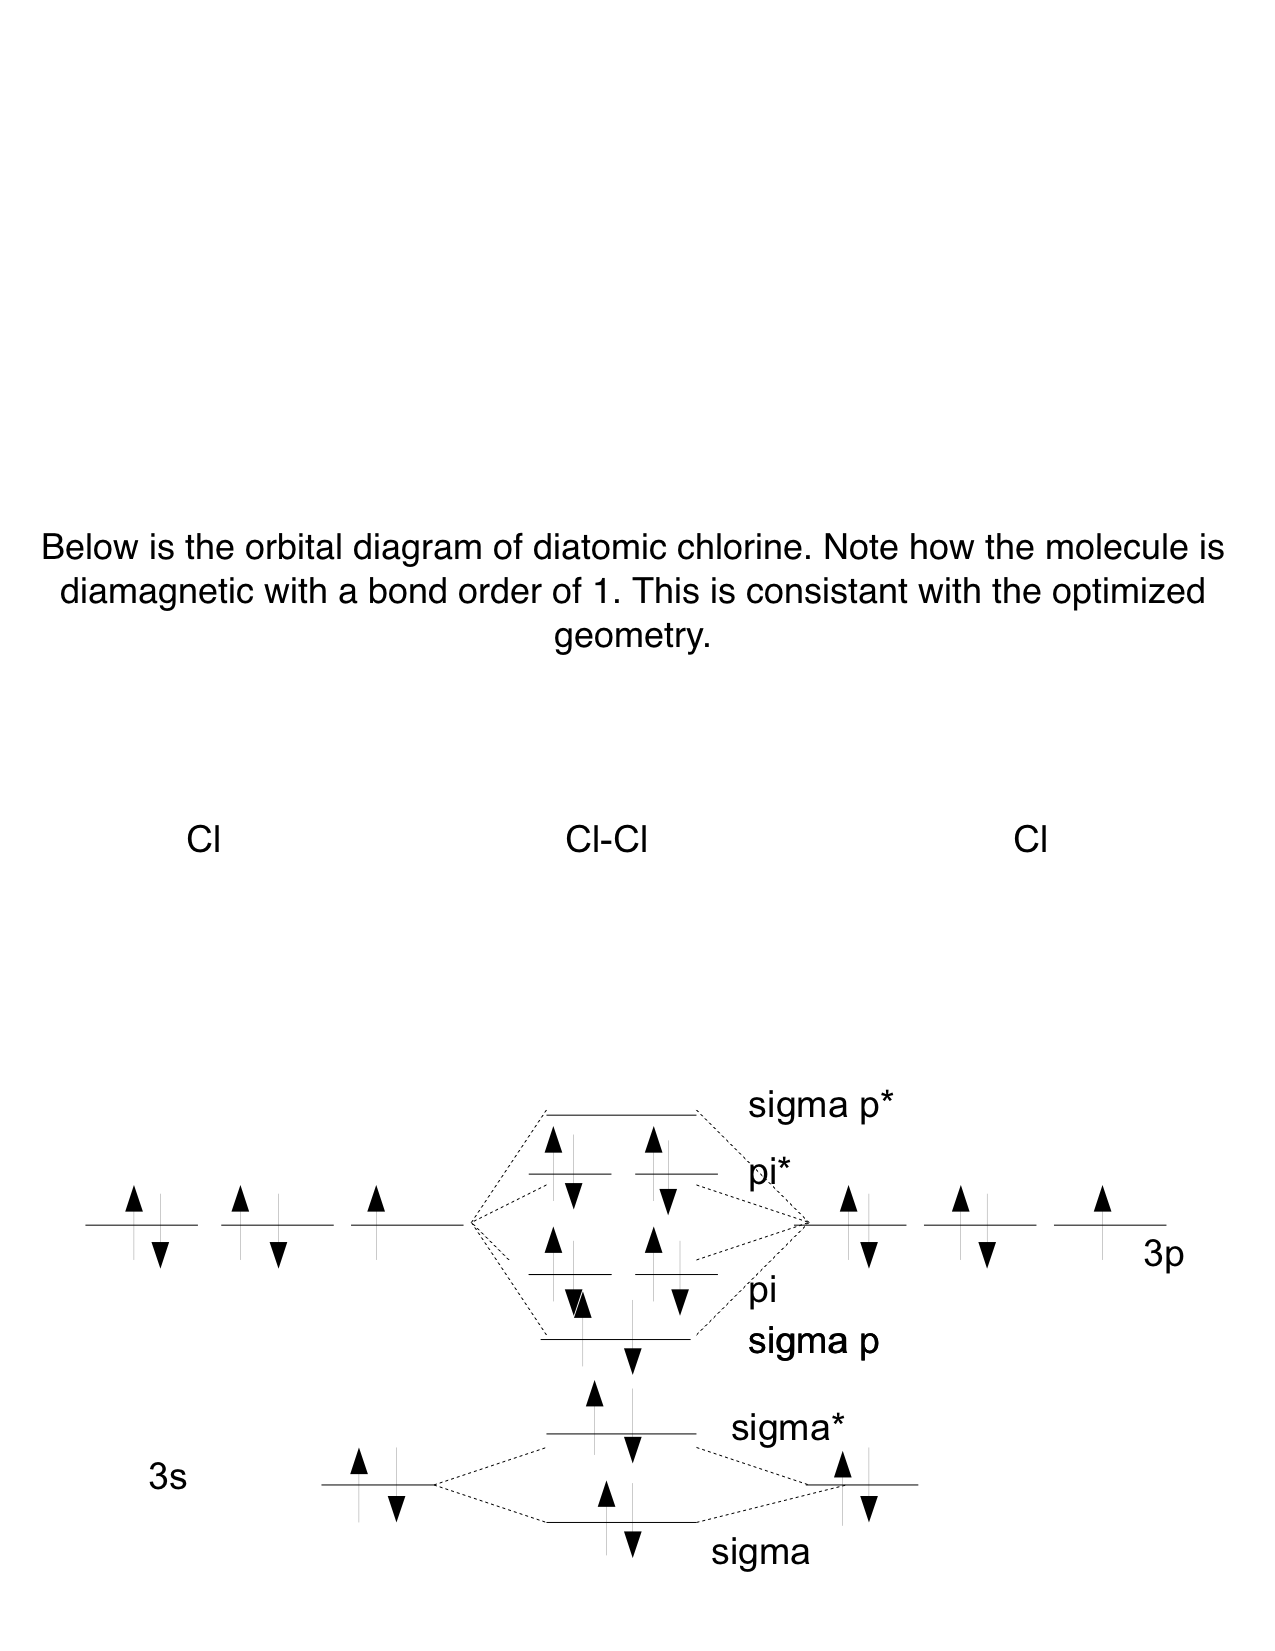
| This is the highest
occupied molecular orbital (HOMO) for diatomic chlorine. |
|
|
|
|
| This shows the lowest unoccupied molecular orbital (LUMO) of chlorine. |
|
|
|
|
| The partial atomic charges of chlorine in a diatomic system are zero, as displayed above. |
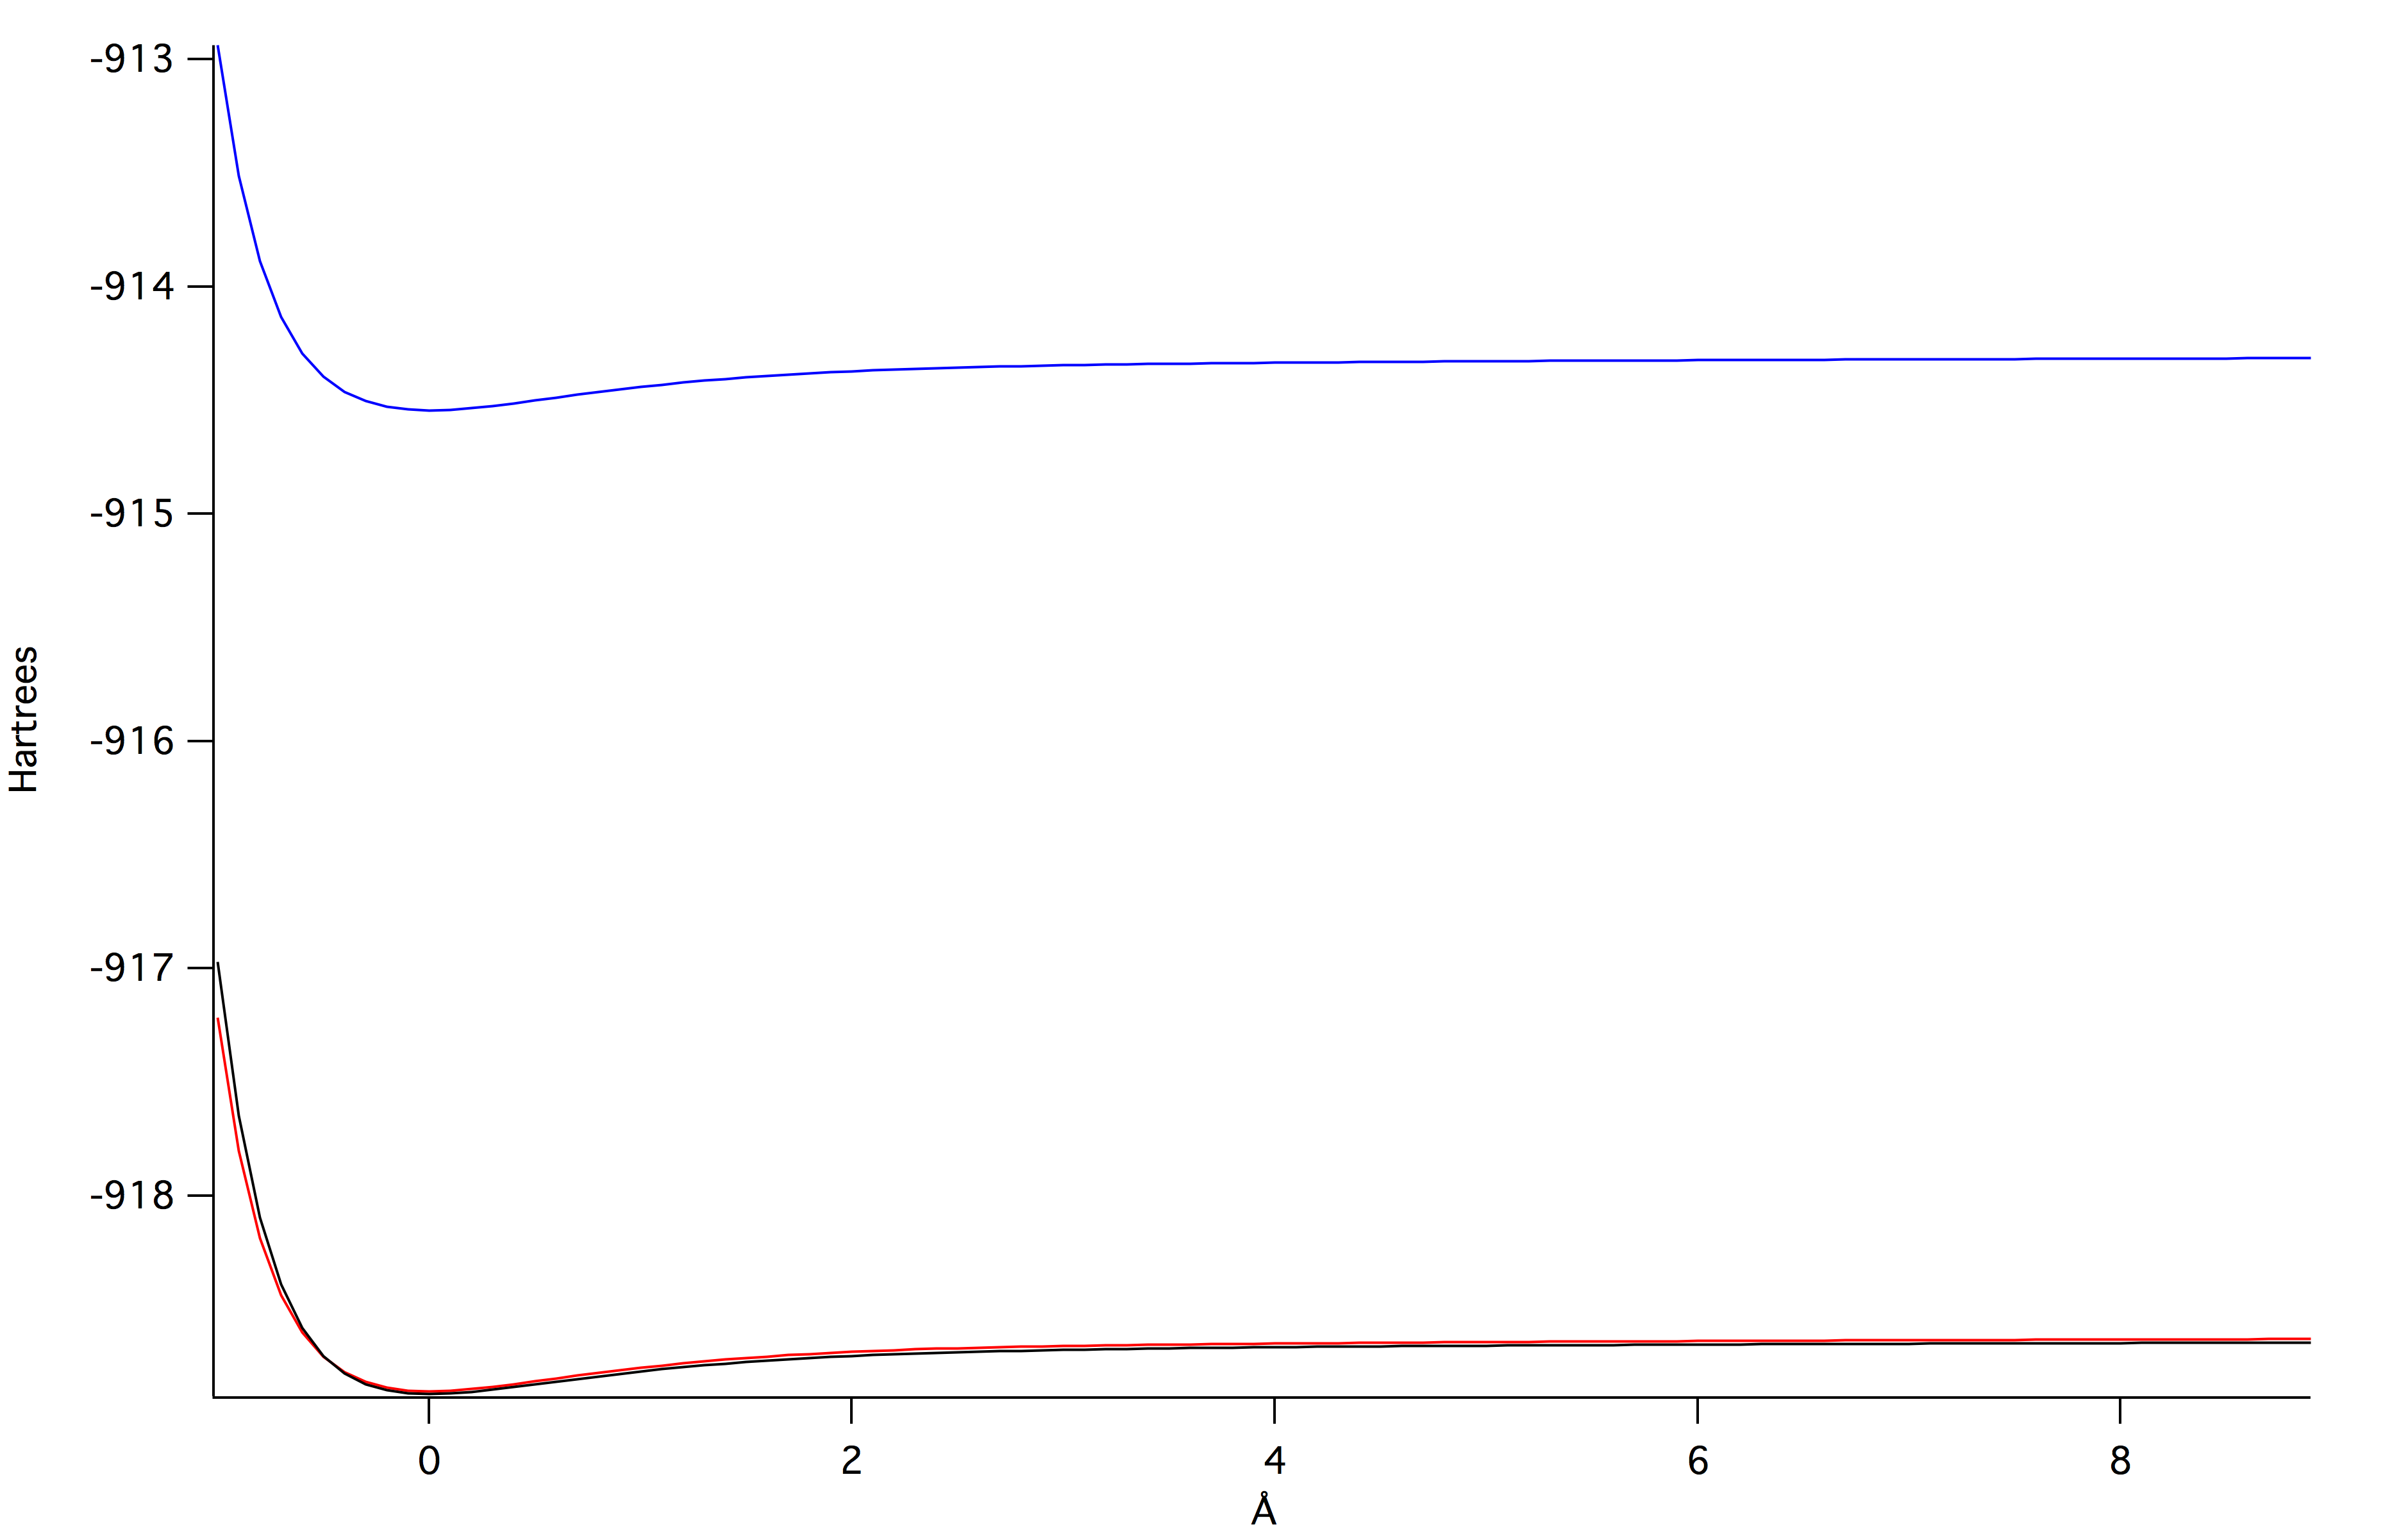
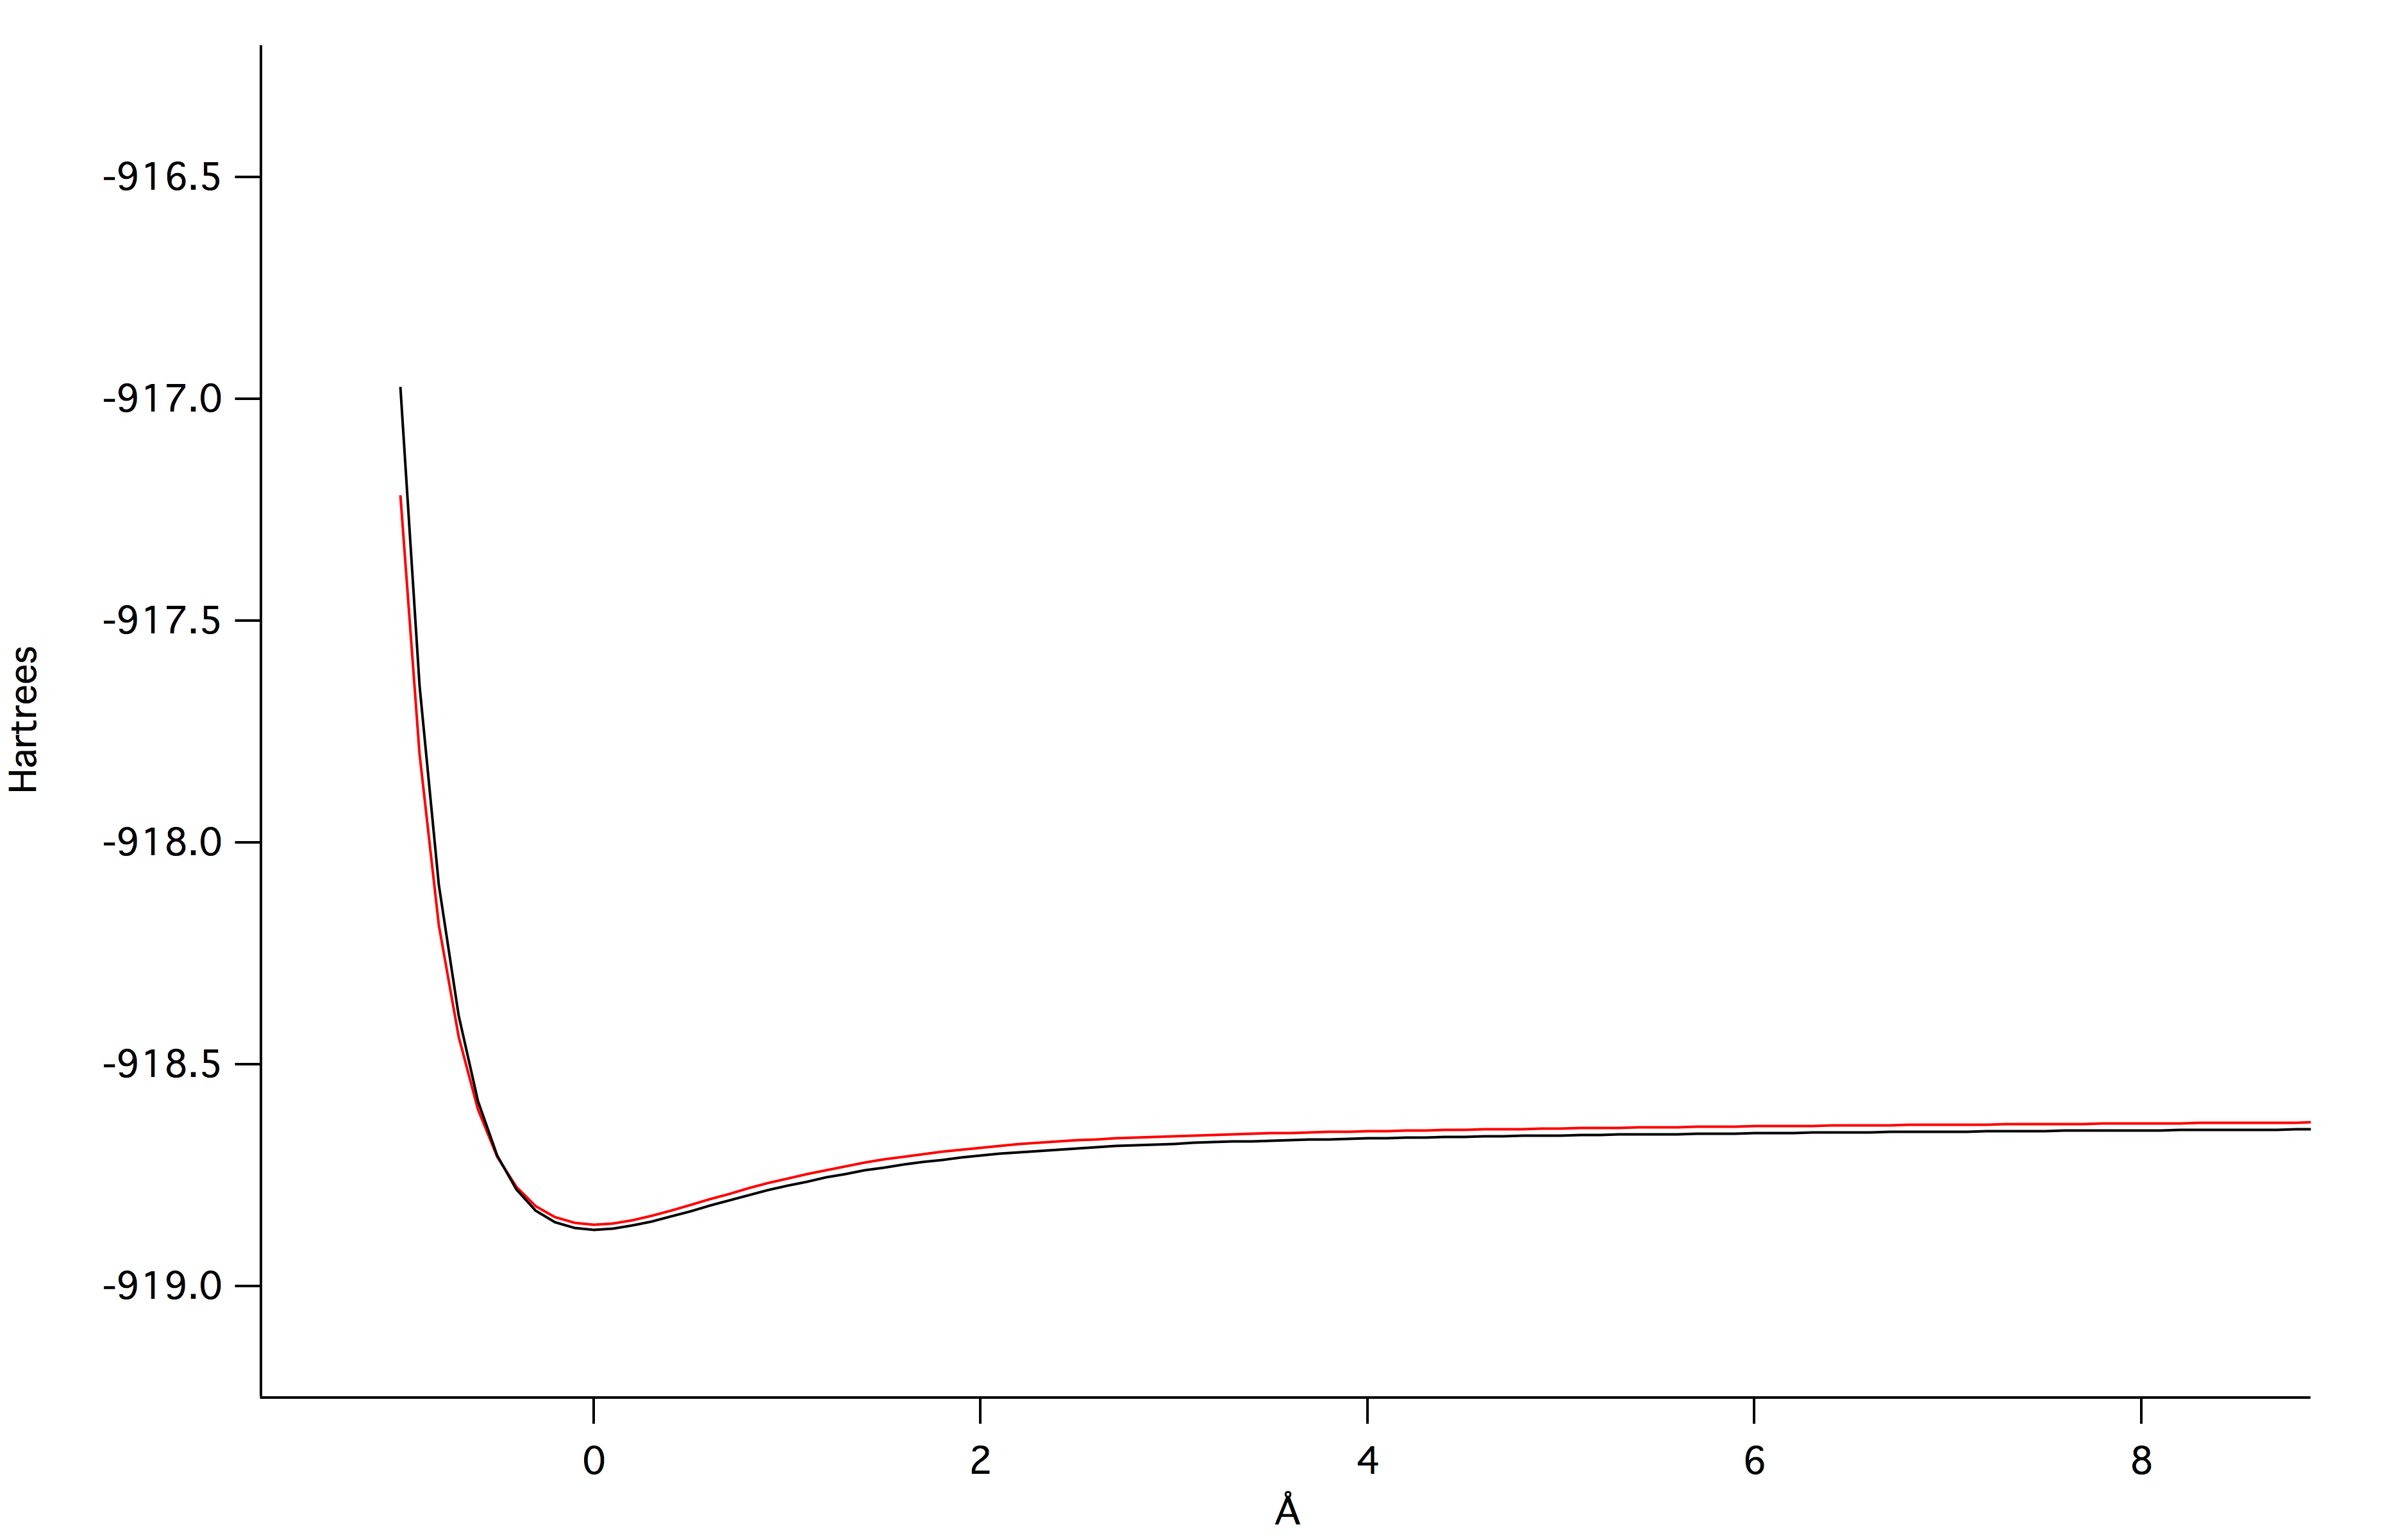
Graphs above are the
potential engergy wells of the different levels of theory. Blue
represents 3-21G, black
represents 6-31G, and red represents DZV. The bottom graph is a zoom of the top graph to show the difference
in energy of the 6-31G and DZV theory levels. Because the 6-31G level of theory is lower engergy, it is
the best calculation.
represents 6-31G, and red represents DZV. The bottom graph is a zoom of the top graph to show the difference
in energy of the 6-31G and DZV theory levels. Because the 6-31G level of theory is lower engergy, it is
the best calculation.
|
|
|
| Shown above is the
electrostatic potential surface for chlorine. |