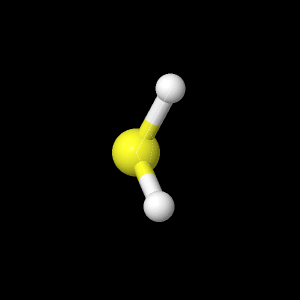
H2S Molecule. Bond lengths and
angles are shown for each basis set, along with
electrostatic potential, HOMO and LUMO molecular orbitals, and the
vibrational frequencies shown are the main contributors as shown in the
IR spectrum for H2S. A table of the dipole moments for H2S are
shown in
Table 1. The dipole moments
vary depending on which basis set was used to do the calculations. The
dipole moment started at a higher amount for the AM1, and it decreased
with increasing basis set. The 3-21G and 6-31G were close to each
other, but further away from excepted values. The PM3 and DZV values
were closest to the accepted values.
The button H2S - AM1 will appear in the box below. The button will show
the bond length and bond angle given for AM1 optimization.
The button H2S - PM3 will appear in the box below. The button will show
the bond length and bond angle given for PM3 optimization.
The button H2S - 3-21G will appear in the box below. The button will
show the bond length and bond angle given for 3-21G optimization.
The button H2S 6-31G will appear in the box below.The button will show
the bond length and bond angle given for 6-31G optimization.
The button H2S DZV will appear in the box below.The button will show
the bond length and bond angle given for DZV optimization.
The button H2S DZV LUMO will appear in the box below. The button will
show the lowest unoccupied molecular orbital for H2S which is the 10th
orbital.
The button H2S DZV HOMO will appear in the box below. The button will
show the highest occupied molecular orbital for H2S which is the 9th
orbital.
The button H2S electrostatic potential will appear in the box below.
The button will show H2S electrostatic potential which is concentrated
on the S atom due to a more negative partial charge as seen in the H2S
partial charge diagram.
The button H2S partial charges will appear in the box below. The button
will show the partial charges for atoms in the H2S molecule.
The button H2S IR 1319.09 will appear in the box below. The button will
show the vibrational frequency at 1319.09 cm^-1. To activate the
vibrational frequency: right click on molecule>vibration>on
The button H2S IR 2670.99cm^-1 will appear in the box below. The button
will show the vibrational frequency at 2670.99 cm^-1. To activate the
vibrational frequency: right click on molecule>vibration>on
The button H2S IR 2690.91cm^-1 will appear in the box below.The button
will show the vibrational frequency at 2690.91 cm^-1. To activate the
vibrational frequency: right click on molecule>vibration>on
Based on template by A. Herráez as modified by J. Gutow
Using directory /Users/students/Desktop/Chris and Becky WebPage/H2S/H2S J pics
  adding JmolPopIn.js
  ...jmolApplet0
      ...adding H2S_-_AM1.png
      ...copying
./Jmol.js
         to
/Users/students/Desktop/Chris and Becky WebPage/H2S/H2S J pics/Jmol.js
      ...copying
./JmolApplet.jar
         to
/Users/students/Desktop/Chris and Becky WebPage/H2S/H2S J pics/JmolApplet.jar
      ...copying
file:/Users/students/Desktop/Chris and Becky/H2S/H2S_AM1_optimization_C&B.log
         to
/Users/students/Desktop/Chris and Becky WebPage/H2S/H2S J pics/H2S_AM1_optimization_C&B.log
      ...adding H2S_-_AM1.spt
  ...jmolApplet1
      ...adding H2S_-_PM3.png
      ...copying
file:/Users/students/Desktop/Chris and Becky/H2S/H2S_PM3_optimization_C&B.log
         to
/Users/students/Desktop/Chris and Becky WebPage/H2S/H2S J pics/H2S_PM3_optimization_C&B.log
      ...adding H2S_-_PM3.spt
  ...jmolApplet2
      ...adding H2S_-_3-21G.png
      ...copying
file:/Users/students/Desktop/Chris and Becky/H2S/H2S_PM3_optimization321G_C&B.log
         to
/Users/students/Desktop/Chris and Becky WebPage/H2S/H2S J pics/H2S_PM3_optimization321G_C&B.log
      ...adding H2S_-_3-21G.spt
  ...jmolApplet3
      ...adding H2S_6-31G.png
      ...copying
file:/Users/students/Desktop/Chris and Becky/H2S/H2S_PM3_optimization631G_C&B.log
         to
/Users/students/Desktop/Chris and Becky WebPage/H2S/H2S J pics/H2S_PM3_optimization631G_C&B.log
      ...adding H2S_6-31G.spt
  ...jmolApplet4
      ...adding H2S_DZV.png
      ...copying
file:/Users/students/Desktop/Chris and Becky/H2S/H2S_PM3_optimizationDVZ2_C&B.log
         to
/Users/students/Desktop/Chris and Becky WebPage/H2S/H2S J pics/H2S_PM3_optimizationDVZ2_C&B.log
      ...adding H2S_DZV.spt
  ...jmolApplet5
      ...adding H2S_DZV_LUMO.png
      ...adding H2S_DZV_LUMO.spt
  ...jmolApplet6
      ...adding H2S_DZV_HOMO.png
      ...adding H2S_DZV_HOMO.spt
  ...jmolApplet7
      ...adding H2S_electrostatic_potential.png
      ...adding H2S_electrostatic_potential.spt
  ...jmolApplet8
      ...adding H2S_partial_charges_.png
      ...adding H2S_partial_charges_.spt
  ...jmolApplet9
      ...adding H2S_IR_1319_09_.png
      ...copying
file:/Users/students/Desktop/Chris and Becky/H2S/H2S_PM3_optimizationDVZvib_C&B.log
         to
      ...compressing large data file to
/Users/students/Desktop/Chris and Becky WebPage/H2S/H2S J pics/H2S_PM3_optimizationDVZvib_C&B.log.gz
/Users/students/Desktop/Chris and Becky WebPage/H2S/H2S J pics/H2S_PM3_optimizationDVZvib_C&B.log.gz
      ...adding H2S_IR_1319_09_.spt
  ...jmolApplet10
      ...adding H2S_IR_2670_99cm_-1.png
      ...adding H2S_IR_2670_99cm_-1.spt
  ...jmolApplet11
      ...adding H2S_IR_2690_91cm_-1.png
      ...adding H2S_IR_2690_91cm_-1.spt