Benzoic
Acid
This page shows an in-depth analysis of the Benzoic Acid molecule. All
of the Jmol representations are from our best experiemental
ab initio theory, 6-31G. 6-31G was
chosen based on the comparison of the experimental bond lengths and
angles from each level of theory to the literature value for the bond
lengths and angles of Benzoic Acid. This comparison was done using the
figures below and the data from
NIST.
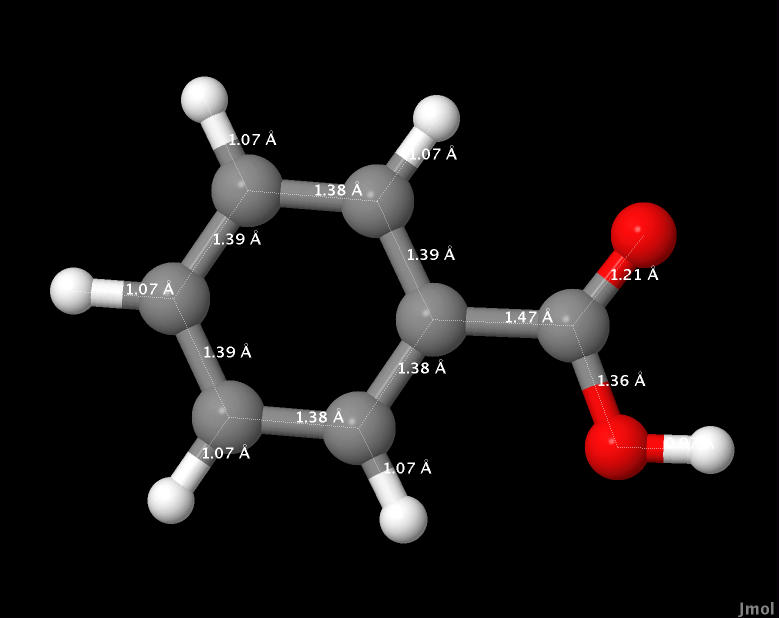
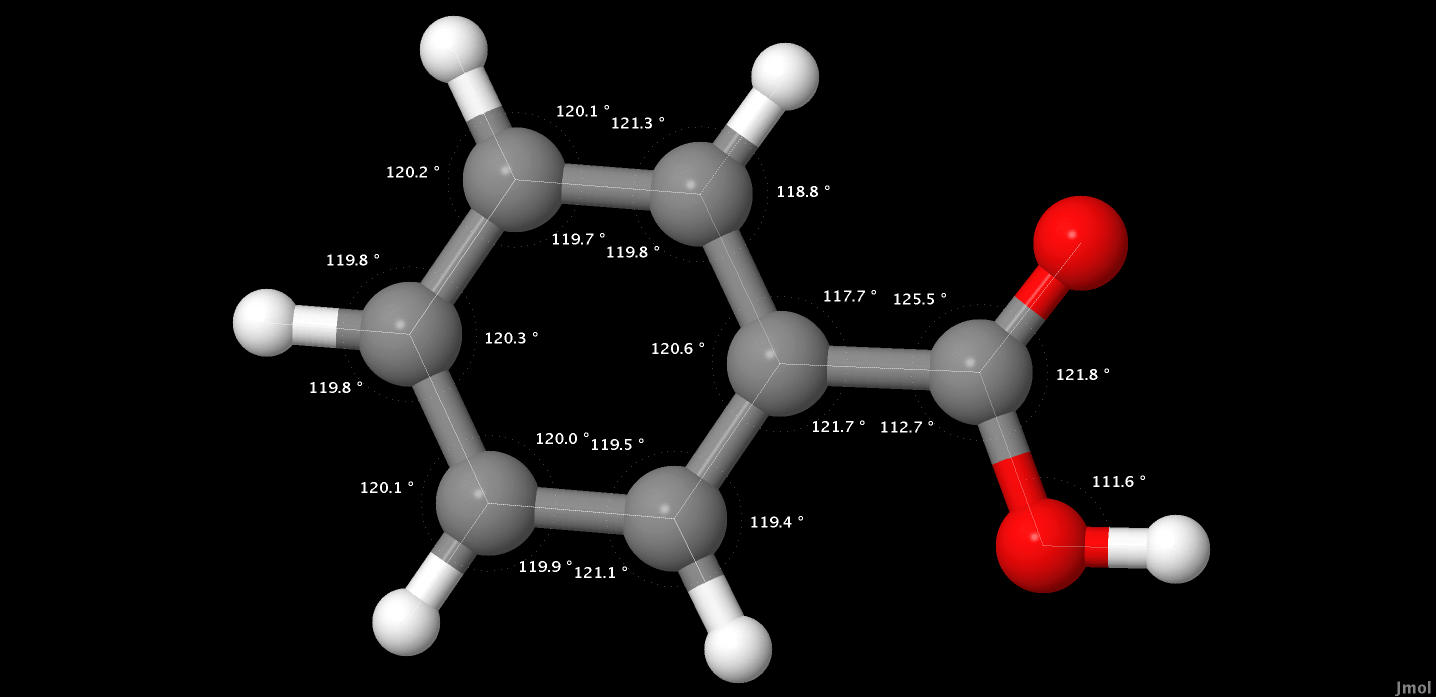 Figure 1: (a)
 Left diagram
represents bond lengths from the 3-21G level of theory and
(b) Right diagram represents bond
angles from the 3-21G level of theory.
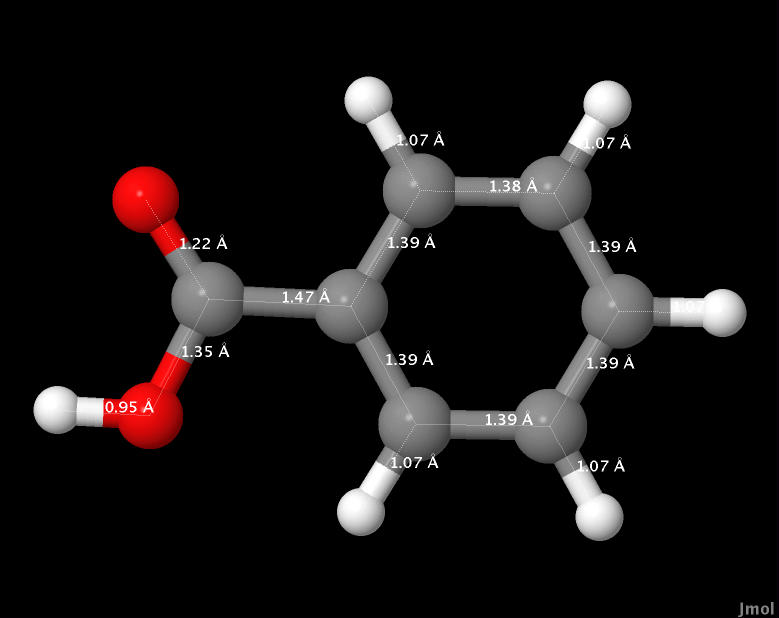
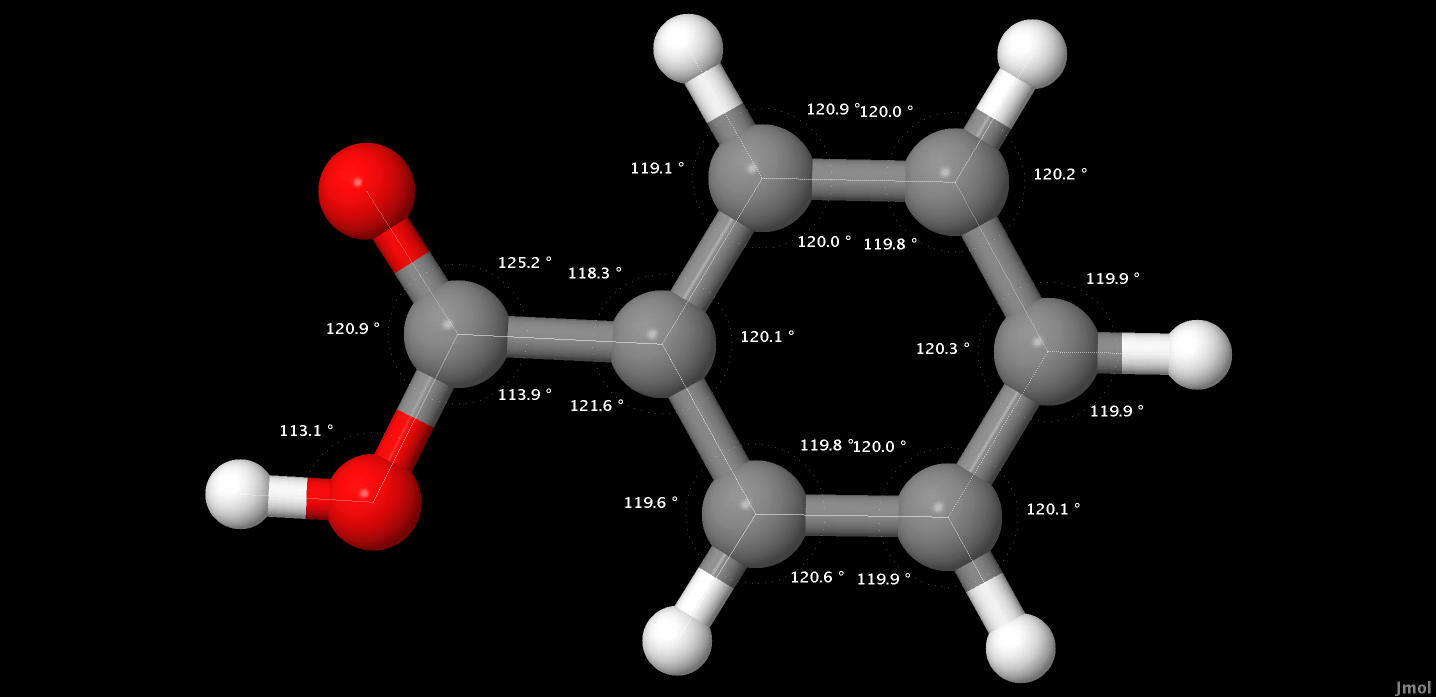 Figure 2: (a)
 Left diagram
represents bond lengths from the 6-31G level of theory and
(b) Right diagram represents bond
angles from the 6-31G level of theory.
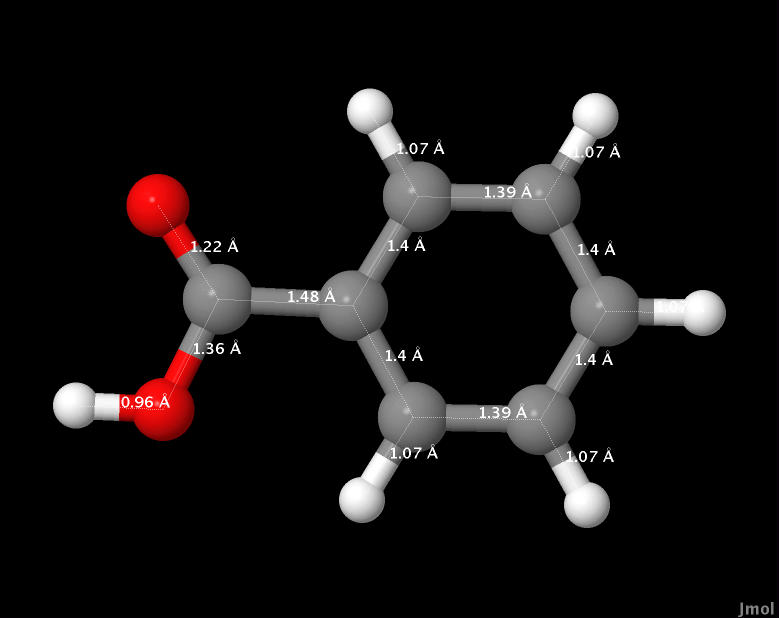
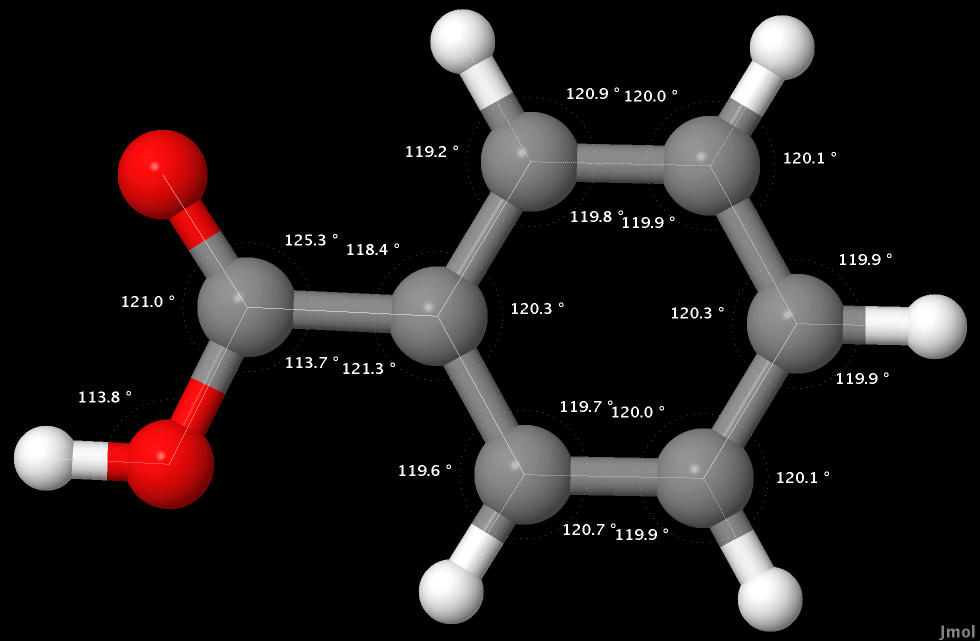 Figure 3: (a)
 Left diagram
represents bond lengths from the DZV level of theory and
(b) Right diagram represents bond
angles from the DZV level of theory.
UV-Vis Absorption Peak Positions

 Figure 4:
 The graph
represents the UV-Vis spectrum of Benzoic Acid.
Table 1: The data presented in
this table represents the correlation between the experimental
wavelengths and the literature values given in Figure 4.
Experimental Wavelength (nm)
|
Literature Values (nm)
|
| 130.161 |
220
|
| 131.876 |
230
|
| 137.688 |
231
|
| 147.07 |
235
|
| 151.987 |
250
|
| 195.745 |
252
|
| 198.697 |
260
|
| 200.876 |
275
|
The Uv-Vis comparison for the 6-31G
ab
initio results and the literature values shows that the
experimental data is fairly incorrect. As a result, the data has
been determined to be useless.
Based on template by A. Herráez as modified by J. Gutow
Using directory /Users/students/Desktop/ Amber & Kyle/ABandKBwebpage/ABandKB Benzoic Acid Webpage
  adding JmolPopIn.js
  ...jmolApplet0
      ...adding Benzoic_Acid_6-31G.png
      ...adding Benzoic_Acid_6-31G.spt
  ...jmolApplet1
      ...adding HOMO_of_Benzoic_Acid_6-31G.png
      ...adding HOMO_of_Benzoic_Acid_6-31G.spt
  ...jmolApplet2
      ...adding LUMO_of_Benzoic_Acid_6-31G.png
      ...adding LUMO_of_Benzoic_Acid_6-31G.spt
  ...jmolApplet3
      ...adding Electrostatic_Potential_of_Benzoic_Acid_6-31G.png
      ...adding Electrostatic_Potential_of_Benzoic_Acid_6-31G.spt
  ...jmolApplet4
      ...adding Dipole_moment_of_Benzoic_Acid_6-31G.png
      ...adding Dipole_moment_of_Benzoic_Acid_6-31G.spt