Styrene Calculations
Our best optimized geometry calculations were used to generate the displays you will see below. The level of ab initio used was 6-311G. The optimum geometry of the molecule was determined by trying different arangemetns of atoms until the energy of the system was at it lowest.
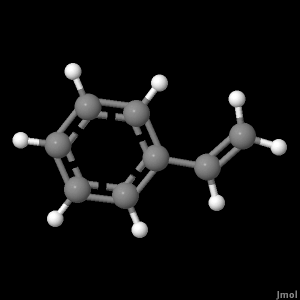
Click the button below to view an image of the optimized geometry for Styrene.
Our best optimized geometry calculations were used to generate the displays you will see below. The level of ab initio used was 6-311G. The optimum geometry of the molecule was determined by trying different arangemetns of atoms until the energy of the system was at it lowest.
Click the button below to view an image of the optimized geometry for Styrene.
Styrene is an arromatic molecule with many different bond lengths and angles. By clicking on the two buttons below you will be able to view images of Styrene's bond lengths (angstroms) and bond angles.
To view experimental bond lengths for Styrene follow this link to the NIST website. The bolded numbers in the table on the website are the ones the calculated values can be compared to.
The difference between the calculated and experimental C-H bonds is about 1.2%, while the difference between the calculated and experimental C-C bonds ranges from about 0.1% to 0.7%.
Click on the button below to see and image of Styrene's HOMO, which stands for highest occupied molecular orbial. Molecular orbitals are defined as the wavefunctions for electrons in the molecule.
Styrene has 48 vibrational modes. By clicking on the buttons below you will be able to see images of the primary vibrational modes for Styrene.
According to the spectrum found on the NIST website all of these vibrations contribute to the major peaks that are present.
UV-vis transitions calculations were performed for the 3-21G and 6-31G levels of theory. Onely transiton with an oscillator strength of 0.2 or greater, from the ground state, were considered.
| Exited State | 3-21G Excitation Energy (eV) | 3-21G Oscillator Strength | 6-31G Excitation Energy (ev) | 6-31G Oscillator Strength |
| 1 | 6.07 | 0.410623 | 5.94 | 0.398984 |
| 3 | 7.75 | 0.816616 | 7.58 | 0.797982 |
| 4 | 8.25 | 0.897162 | 8.10 | 0.922298 |
| 6 | 9.34 | 0.248823 | 9.20 | 0.430590 |
To view a Styrene UV-vis spectra follow this link to the NIST website. Th most prominent peak is the one with the greatest oscillator stregth, which is the transition from the ground state to the 4th exited state . The second most prominent peak is due to the transition to the 3rd exited state.
The table below shows the calculated and experimental dipole moments for Styrene.
| Level of Theory | Calculated Dipole Moment (debye) | Experimental Dipole Moment (debye) |
| 3-21G | 0.107543 | 0.140 |
| 6-31G | 0.158199 | 0.140 |
| 6-311G | 0.159057 | 0.140 |
All of our calculated results were compared to experimental data found on the NIST website:
http://cccbdb.nist.gov/
Page skeleton and JavaScript generated by export to web function using Jmol 11.6.6 2008-09-20 22:06 on Mar 17, 2009.