HF Calculations
Our best optimized geometry calculations were used to generate the displays you will see below. The level of ab initio used was 6-311G. The optimum geometry of the molecule was determined by trying different arangemetns of atoms until the energy of the system was at it lowest.
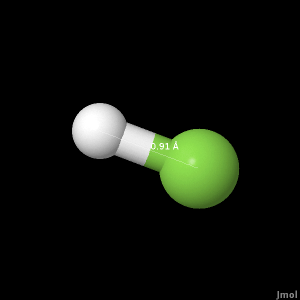
HF is a linear molecule with a bond length of 0.91 angstroms. By clicking the button below you will be able to see a display of the optimized geometry for HF along with it bond length measured in angstroms.
The experimental bond length for HF was found to be 0.917 angstroms on the NIST website. As you can see the calculated and experimental bond length are very similar. The difference between them is only about 0.8%.
Below is a graph of the potential energy vs. bond length for HF at each level of theory. The potential energy is measured in Hartrees, while the bond length is measured in angstroms. The three levels of theory used for the calculations were 3-21G, 6-31G, and 6-311G, as shown in the legend.
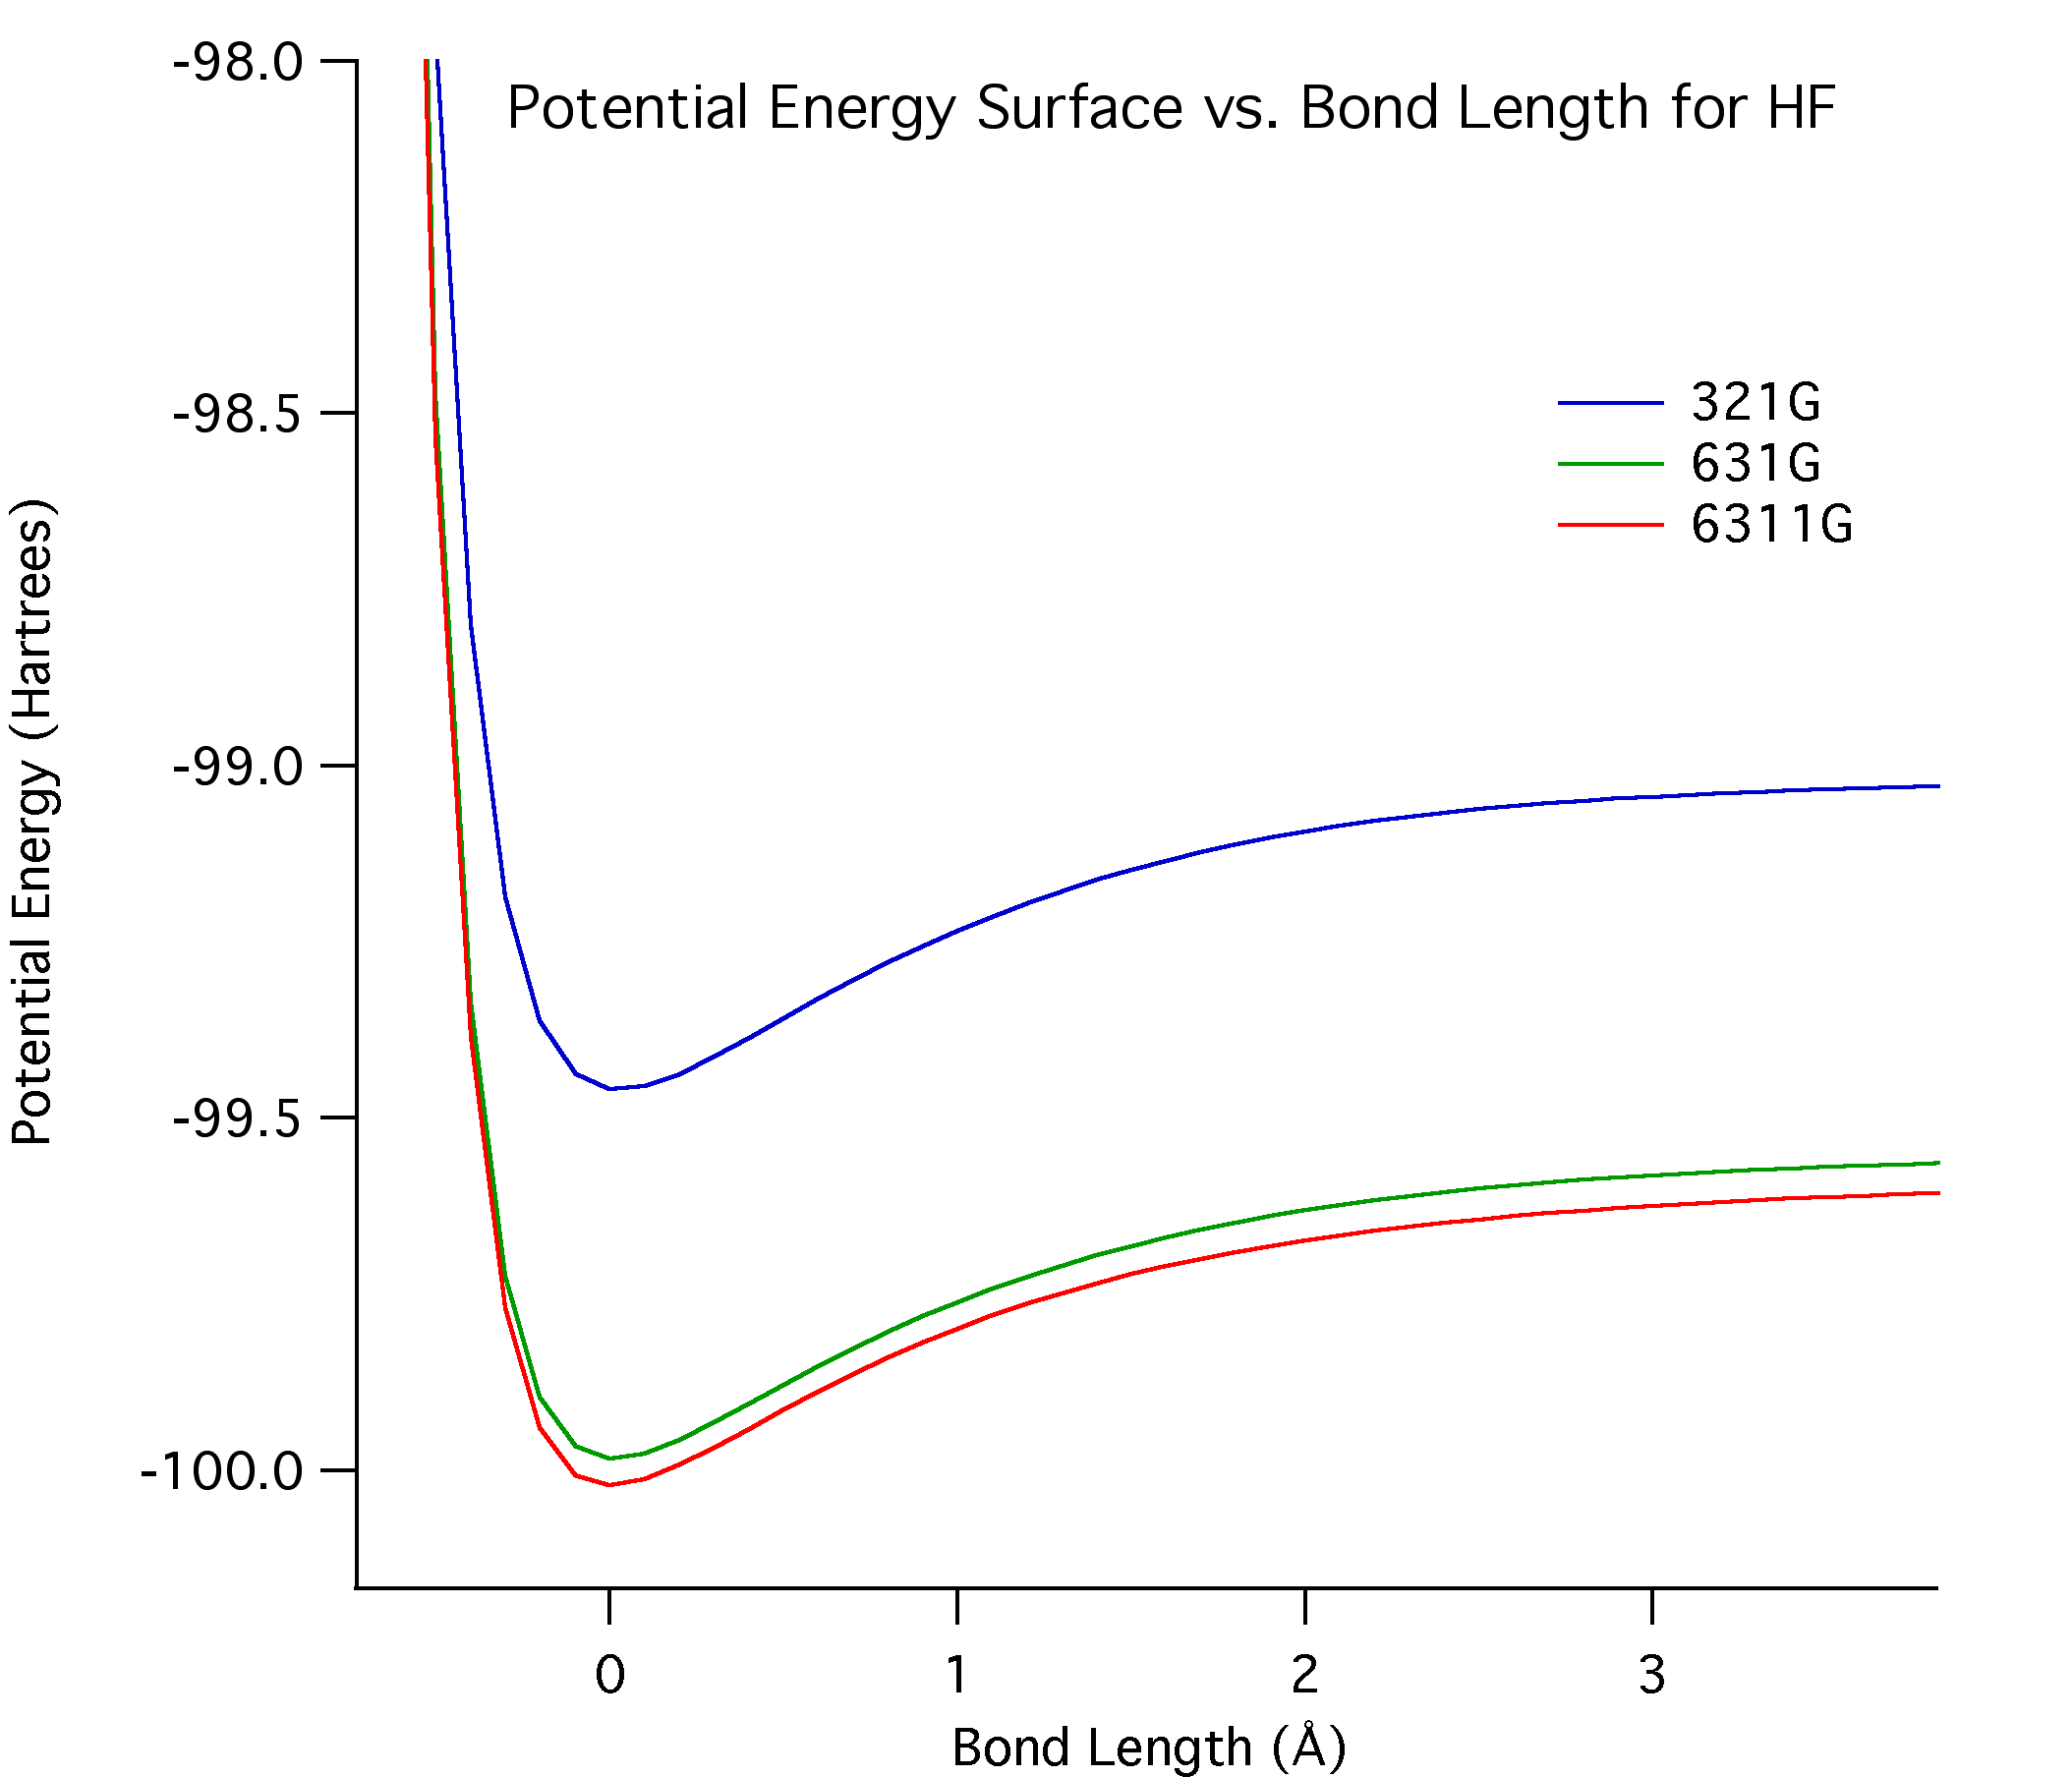
The minimum of the curve represents the equilibrium bond length for HF. The curve minimum is also the minimum energy of the molecule and its depth is closely related to the bond dissocialtion energy. The bond dissociation energy is the energy needed to break the bond between the atoms. The difference between the 6-31G and the 3-21G is about 0.6 Hartrees, while the difference between the 6-31G and the 6-311G is only about 0.05 Hartrees.
Clicking the button below will bring up an image of HF's HOMO, which stands for highest occupied molecular orbial. Molecular orbitals are defined as the wavefunctions for electrons in the molecule
The button below will show the single vibrational mode for HF.
The calculated vibrational frequency for HF was 4106.56 cm-1. The experimental vibrational frequency is 4138.4 cm-1, which was found on the NIST website. Just as with the bond length, the difference between the calculated and experimental frequency is about 0.8%. To view an IR specta of HF visit the NIST website.
The table below shows the calculated and experimental dipole moments of HF.
| Level of Theory | Calculated Dipole Moment (debye) | Experimental Dipole Moment (debye) |
| 3-21G | 2.173555 | 1.82 |
| 6-31G | 2.301179 | 1.82 |
| 6-311G | 2.325324 | 1.82 |
As you can see the calculated dipole moments are much higher than the experimental. This makes sense because approximations were used in the calculations.
All of our calculated results were compared to experimental data found on the NIST website:
http://cccbdb.nist.gov/
Page skeleton and JavaScript generated by export to web function using Jmol 11.6.6 2008-09-20 22:06 on Mar 17, 2009.