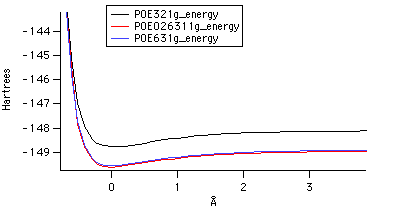
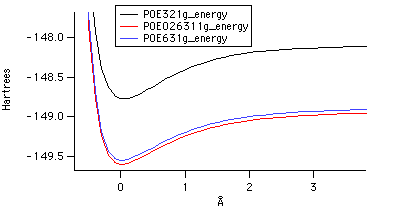
On
the left is a graph of the bond potential energy. The graph on
the right shows a closer view of the graph on the left. The graph
on the right shows that there are actually differences between the
6-31G and 6-311G levels of theory.
The above graphs are of
the bond potential energy of the doubel bond in diatiomic oxygen.
The differnt lines show the differnt levels of theory and the
higher level of theory corilated to a more accurate potential.
There was no vibrational data for diatomic oxygen.
Click here to return to homepage.
Based on template by A. Herráez as modified by J. Gutow
Using directory /Users/Shared/jba/WEBPAGE/diatomc o2/diatomc o2/diatomc o2
  adding JmolPopIn.js
  ...jmolApplet0
      ...adding Oxygen.png
      ...copying
/Users/Shared/jba/o2/o2_6311g_vib.log
         to
/Users/Shared/jba/WEBPAGE/diatomc o2/diatomc o2/diatomc o2/o2_6311g_vib.log
      ...copying
Jmol.js
         to
/Users/Shared/jba/WEBPAGE/diatomc o2/diatomc o2/diatomc o2/Jmol.js
      ...copying
JmolApplet.jar
         to
/Users/Shared/jba/WEBPAGE/diatomc o2/diatomc o2/diatomc o2/JmolApplet.jar
      ...adding Oxygen.spt
  ...jmolApplet1
      ...adding Oxygen_bond_length.png
      ...adding Oxygen_bond_length.spt
  ...jmolApplet2
      ...adding Homo_O2.png
      ...adding Homo_O2.spt