Nitrobenzene Quantum Calculations
All of the displays on this page were created using our best optimized geometry calculations. The level of ab initio theory used was 6-311G. During the calculation, the geometry was approximated with a "balls on springs" model. Once the calculation was completed, the geometry with the lowest energy conformation was chosen as the optimum.
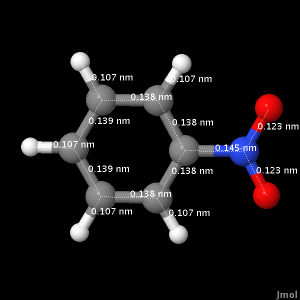
By clicking on the Bond Length button below, a live display of the optimized geometry for nitrobenzene will appear with the bond lengths in nanometers. You are free to rotate the molecule to get a better view.
The following table shows experimental bond length values from the NIST website.3
Table 1. Experimental bond lengths for nitrobenzene
| Bond ID | Bond Length (nm) |
| All C-C bonds | 0.1399 |
| All N-O bonds | 0.1223 |
| All C-H bonds | 0.1093 |
| N-C bond | 0.1486 |
Upon comparison, the calculated values for the C-C bonds are shorter by 0.001 nm at the most. The N-O bonds are 0.001 nm longer, the C-H bonds are 0.002 nm shorter, and the N-C bond is 0.003 nm shorter.
Click the bond angle button below to view all the angles of nitrobenzene. The molecule can be rotated to get a better view.
Figure 1 below is an image of nitrobenzene with its atoms numbered. These numbers correspond with the angle ID in the table of experimental bond angle values following the image.
Figure 1. Atom numbers for nitrobenzene bond angles
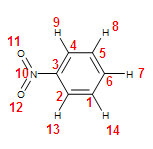
Table 2. Experimental and calculated bond angles for nitrobenzene3
| Angle ID | Experimental Bond Angle (Degrees) | Calculated Bond Angle (Degrees) |
| 2,3,4 | 123.4 | 122.2 |
| 3,4,5 | 117.7 | 118.6 |
| 4,5,6 | 120.5 | 120.1 |
| 5,6,1 | 120.2 | 120.4 |
| 2,3,10 | 117.3 | 118.9 |
| 12,10,11 | 125.3 | 123.4 |
The experimental bond angles don't include every bond angle because perfect symmetry is assumed. The error between the calculated and experimental bond angles ranges from 1.5% (on angle 12,10,11) to 0.2% (on angle 5,6,1).
The button below displays the HOMO for nitrobenzene as calculated by GAMESS.
According to MacMolPlt, the HOMO displayed are made completely of carbon Pz orbitals, which contribute to the benzene ring bonds.
Vibration 1.17 will display one of the vibrational modes for nitrobenzene.
The frequency of this vibration is 771.3 cm-1. This frequency, as well as the others below, can be compared to the IR spectrum of nitrobenzene from the NIST website.4
Vibration 1.18 is another mode of vibration that can be identified in the IR spectrum. Its frequency is 891.24 cm-1.
Vibration 1.32 has a frequency of 1503.02 cm-1.
Vibration 1.34 has a frequency of 1651.52 cm-1.
Vibration 1.39 has a frequency of 3371.52 cm-1.
Vibration 1.40 has a frequency of 3389.5 cm-1.
According to the NIST4 spectrum, all of these vibrations contribute to the major peaks that are present. As can be seen from the animations, Vibrations 1.17 and 1.18 are C-H and C-N bends. Vibration 1.32 is mostly the nitro group stretch, and 1.34 is a mixture of aromatic ring and nitro group stretches. Vibrations 1.39 and 1.40 are stretches from the C-H bonds.
Upon comparison with the NIST spectrum, it is apparent that a few of the calculated values are too high. Vibrations 1.39 and 1.40 appear near 3100 cm-1 rather than in the 3300-3400 cm-1 range. The other vibrations appear to be at a reasonable value. Vibration 1.34 is also slightly high, as the spectrum indicates a peak at 1600 cm-1.4
UV-Vis transition calculations were done using the basis sets 3-21G and 6-31G. Only transitions from the ground state with oscillator strengths greater than 0.1 were considered. The table below contains their values.
Table 3. The excitation energies calculated for nitrobenzene
| Excited State | 3-21G Excitation Energy (1/cm) | 3-21G Oscillator Strength | 6-31G Excitation Energy (1/cm) | 6-31G Oscillator Strength |
| 4 | 50568.19 | 0.184302 | 48629.45 | 0.224847 |
| 5 | 57347.09 | 0.116835 | 56375.41 | 0.133235 |
| 6 | 64465.24 | 0.779665 | 62501.07 | 0.699575 |
| 7 | 67844.62 | 0.619304 | 65939.65 | 0.500196 |
| 9 | 77531.58 | 0.357331 | 75641.82 | 0.423795 |
| 10 | - | - | 77237.58 | 0.682538 |
For an example of a nitrobenzene UV-Vis spectrum, see this NIST webpage.4 The most prominent absorption peak on the spectrum must be caused by the excitation with the largest oscillator strength. This is the excitation to the 6th state. The second most prominent peak is most likely due to the excitation to the 7th state in the 3-21G calculation and the 10th state in the 6-31G calculation. The excitation to the 10th state is the major difference between the two basis set calculations. The oscillator strength in the 3-21G calculation is below 0.1. All the other excitations vary similarly in oscillator strength between basis sets.
Page skeleton and JavaScript generated by export to web function using Jmol 11.6.6 2008-09-20 22:06 on Mar 17, 2009.