Once the molecule file is fully loaded, the image at right will become live. At that time the "activate 3-D" icon ![]() will disappear.
will disappear.
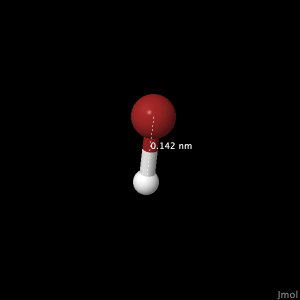
Hydrogen Bromide
The highest level of theory used to determine bond length,
electrostatic potential, and partial chargers was the DZV optimization.
The bromide atom can be seen in red, and the hydrogen in white. Bond Length:
The literature[1] bond length found was 0.1414nm. The bond angle is 180°.
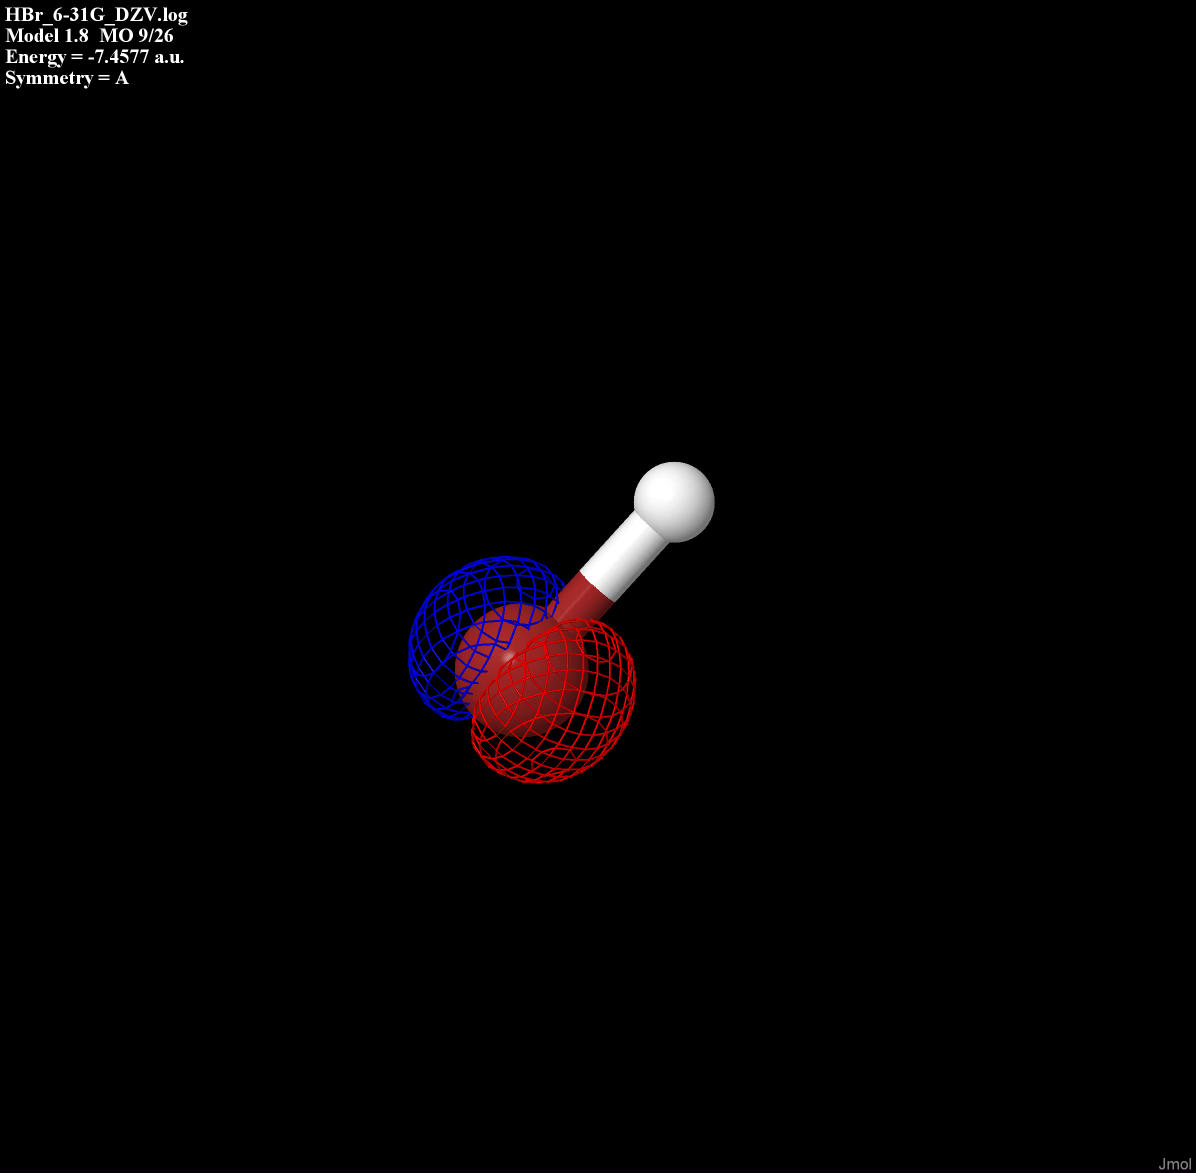
HOMO and LUMO
The highest occupied molecular orbital (HOMO) and the lowest unoccupied molecular orbital (LUMO) can be seen below.
Figure 1: Valence electron energy levels for HBr
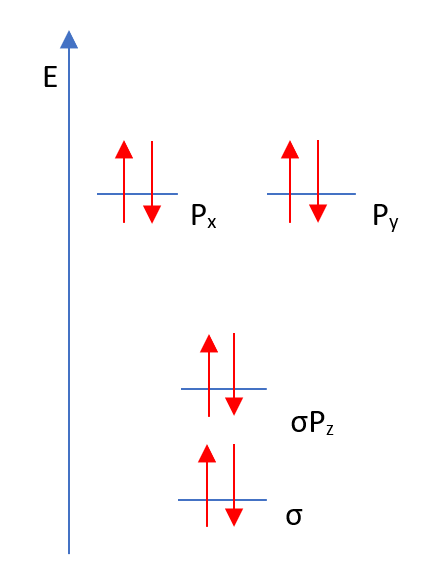
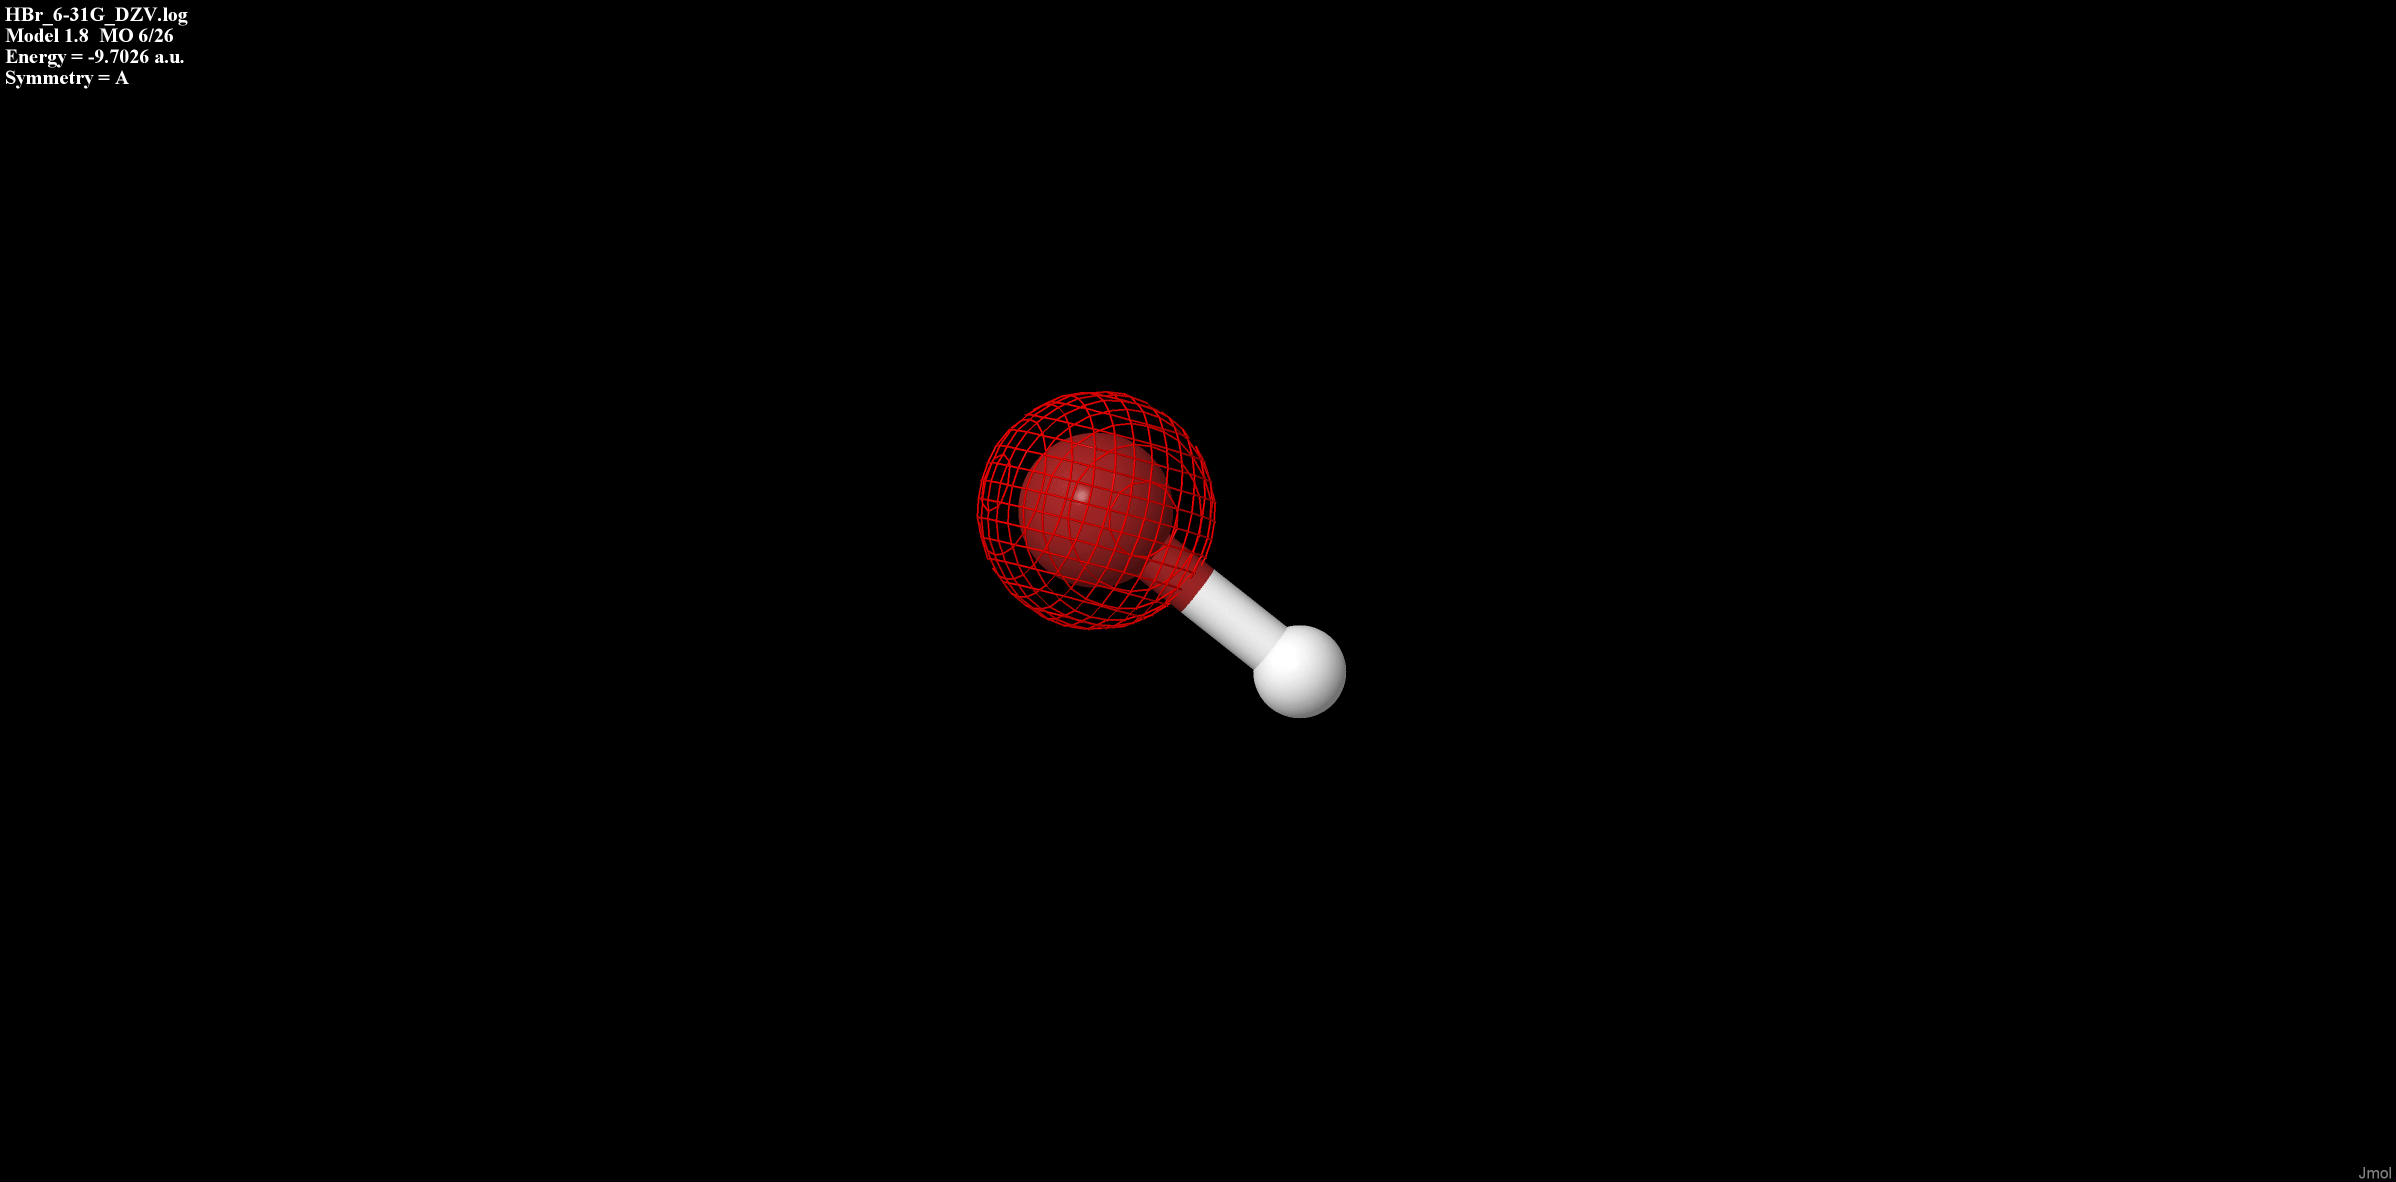
Each orbital form above is displayed in Table 1.
Table 1: Type of bonding for each orbital of HBr
Vibration:
The following vibration is the stretching occurring at 2635.85cm-1. The literature[1] value for this vibration is 2649cm-1.
Table 1: Type of bonding for each orbital of HBr
| Type of Bonding |
Orbital |
| Sigma non-bonding |
 |
| Px non-bonding |
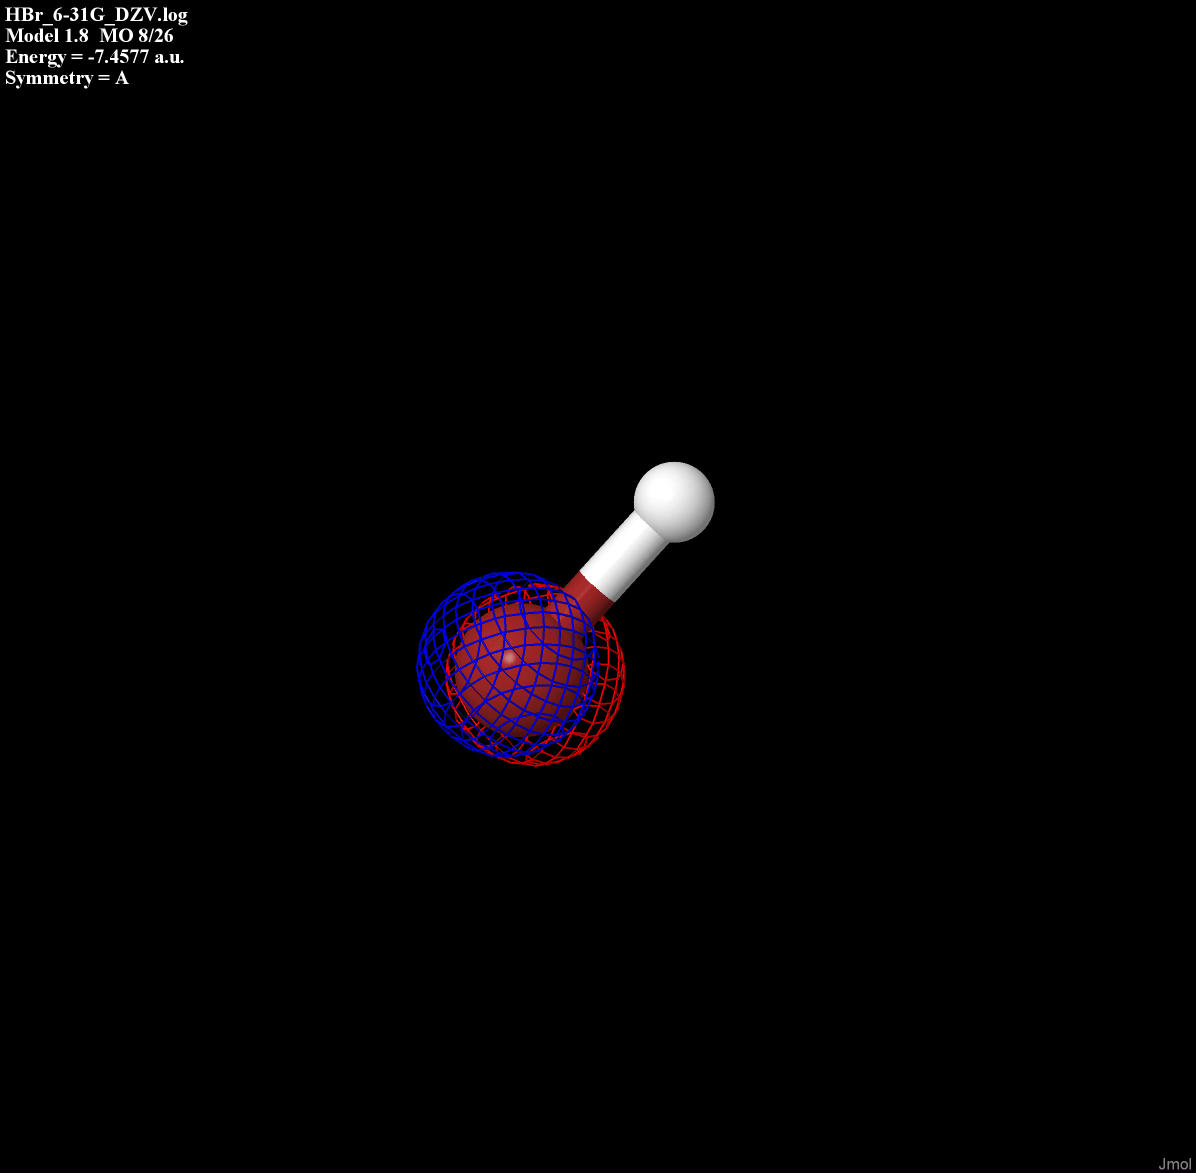 |
| Py non-bonding |
 |
Vibration:
The following vibration is the stretching occurring at 2635.85cm-1. The literature[1] value for this vibration is 2649cm-1.
Electrostatic Potential:
The electrostatic potential shows the charge distribution, or where the electrons are most likely to be, throughout the whole molecule. Areas that are red are low potential and have more electrons present. The blue ares have the highest potential and lowest amount of electrons.
The red area is surrounding the bromine atom which is more
electronegative then the hydrogen which is surrounded by blue. This
means there are more electrons on the bromine atom.
The electrostatic potential shows the charge distribution, or where the electrons are most likely to be, throughout the whole molecule. Areas that are red are low potential and have more electrons present. The blue ares have the highest potential and lowest amount of electrons.
Partial Charges:
The partial charge on the bromide atom is -0.11705, signifying that it is pulling more electrons towards itself. Hydrogen has a positive partial charge of 0.11705.
Dipole Moments:
The dipole moment measures the polarity of the molecule and occurs because the electrons are not shared equally. Table 2 lists the dipole moments at each level of geometry optimization for HBr. The literature[1] dipole moment is 0.827D.
Table 2: Experimentally calculated dipole moments for four different theories and bsed off of the literature value.
Further calculations were done to try and improve the dipole moment
associated with the DZV optimization. The input for these calculations
was different because the number of heavy and light atom polarization
functions was set to a value greater than zero, and changed each time.
Seven attempts were made and the best dipole moment achieved was 0.933D
with a 12.8% error.
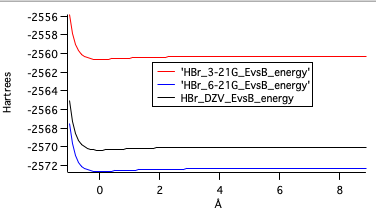
Last is a graph depicting the potential energies for the three ab initio levels of optimization. Typically the energy level lowers as the level of theory gets higher. DZV should be the lowest but was calculated a bit higher than 6-31G.
The partial charge on the bromide atom is -0.11705, signifying that it is pulling more electrons towards itself. Hydrogen has a positive partial charge of 0.11705.
The dipole moment measures the polarity of the molecule and occurs because the electrons are not shared equally. Table 2 lists the dipole moments at each level of geometry optimization for HBr. The literature[1] dipole moment is 0.827D.
Table 2: Experimentally calculated dipole moments for four different theories and bsed off of the literature value.
| Optimization Level |
Dipole Moment (D) |
Percent Error (%) |
| AM1/PM3 |
1.26 |
51.9 |
| 3-21G |
1.31 |
58.0 |
| 6-31G |
1.43 |
72.9 |
| DZV |
1.50 |
81.4 |
Last is a graph depicting the potential energies for the three ab initio levels of optimization. Typically the energy level lowers as the level of theory gets higher. DZV should be the lowest but was calculated a bit higher than 6-31G.
You may look at any of these intermediate views again by clicking on the appropriate button.
Page skeleton and JavaScript generated by the Export to Web module of Jmol 14.29.46 2019-06-03 12:50 on Oct 8, 2019.
If your browser/OS combination is Java capable, you will get snappier performance if you use Java