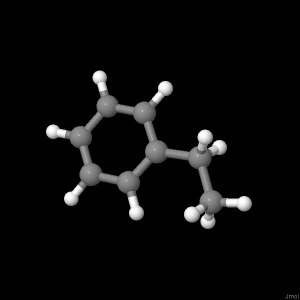
Once the molecule file is fully loaded, the image at right will become live. At that time the "activate 3-D" icon will disappear.
Sample of the Vibration Frequencies for Ethyl Benzene
The frequency of vibrations for ethyl benzene were calculated from the ab initio
DZV basis set. These frequencies correspond to the frequencies at which
IR peaks should be observed. A total of 48 vibrational frequencies were
calculated for ethyl benzene. A sample selection of the characteristic
bending and stretching vibrations can be viewed on this page by
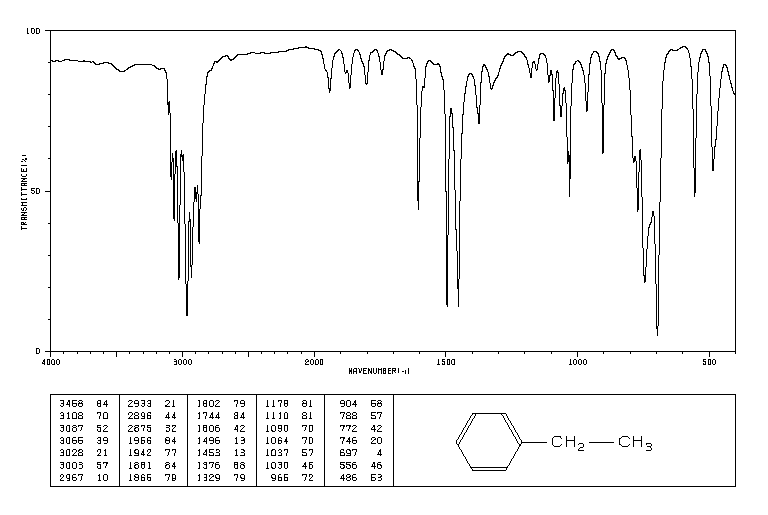
selecting the appropriate button. Table1 lists the select calculated frequencies and Figure 1 is a reference IR spectrum of ethyl benzene prepared neat as a liquid film.
You may look at
any of these intermediate views again by clicking on the appropriate
button or click the "Ethyl Benzene" button below to return the molecule to a stationary
view.
Table 1: Select calculated vibrational frequencies of ethyl
benzene. Calculations were performed using the DZV basis set and
represent only a few of the frequencies predicted.
Calculated Frequency (cm-1)
Description of Vibration
Ring out of plane (OOP) bending
Ring breathing
Asymmetric aromatic C=C stretch
Symmetric aromatic C=C stretch
sp3 C-H alternating symmetric stretch
sp3 C-H symmetric stretch
Aromatic sp2 C-H asymmetric stretch
Aromatic sp2 C-H symmetric stretch
Figure 1: IR spectrum of neat ethyl benzene. Spectrum obtained from the SDBS website.